St Paul’s Girls’ School

Hammersmith, London

Latest published: summer 2026 exams

Latest results

Sixth form

A* or equivalent · out of 389 entries · summer 2025 exams

66.8%

Compared

SPGS: A* or equivalent rose from 42% in 2013 to 66.8% in 2025, over the 8 years we can compare.

Open original: Sixth form, St Paul’s Girls’ School The record, year by year

Source and checks
  • 66.8%

    88.7% A*–A · 95.6% A*–B

    A-level entries graded A*

    of 389 entries · summer 2025 exams

    Provisional

    Published before the final figures; the school may revise it.

    SPGS provisional A-level results, as at 10 October 2025, page 1 Open original: SPGS provisional A-level results, as at 10 October 2025

    Record page

    Cite

    St Paul’s Girls’ School. A-level entries graded A*: 66.8% of 389 entries, summer 2025 exams. Status: Provisional. Source: SPGS provisional A-level results, as at 10 October 2025, page 1, https://spgs.org/wp-content/uploads/2025/09/Sum25-Web-Results-as-of-10-Oct.pdf. The Schools Record, https://theschoolsrecord.co.uk/evidence/fig:spgs_exam_anchors:4/

    Report a problem

GCSE

A* / 9–8 · 966 of 1,032 entries · summer 2016 exams

93.6%

Compared

Our latest figure is for 2016. SPGS’s 2017 table prints more grades than entries, so its figures don’t add up. SPGS: A* or 9–8 grades rose from 52.9% in 1994 to 93.6% in 2016, over the 16 years we can compare.

Open original: GCSE, St Paul’s Girls’ School The record, year by year

Source and checks
  • 93.6%

    99.6% A*–A · 100% A*–B

    GCSE/IGCSE entries graded A*

    of 1,032 entries · summer 2016 exams

    Checked against the original

    SPGS2016 FINAL I/GCSE examination results, page 1 Open original: SPGS2016 FINAL I/GCSE examination results

    Checked by TSR

    Cite

    St Paul’s Girls’ School. GCSE/IGCSE entries graded A*: 93.6% of 1,032 entries, summer 2016 exams. Status: Checked against the original. Source: SPGS2016 FINAL I/GCSE examination results, page 1, https://spgs.org/wp-content/uploads/2021/02/GCSE-Results-2016.pdf. Checked by The Schools Record on 6 September 2026. The Schools Record, https://theschoolsrecord.co.uk/evidence/research:spgs:2016:gcse-igcse:original-sheet/

    Report a problem

Oxford and Cambridge

Oxford offers · of 65 applications from the school · 2025 admissions round

29

Checked against the original

Offers aren’t places: one pupil can hold several offers but take up one place.

Open original: Oxford and Cambridge, St Paul’s Girls’ School Every year of offers

Source and checks
  • 29

    Oxford offers

    of 65 applications from the school · 2025 admissions round

    Checked against the original

    University of Oxford: applications, offers and acceptances by applicant’s school (UCAS), annual 2024 and 2025 cycles Open original: University of Oxford: applications, offers and acceptances by applicant’s school (UCAS), annual 2024 and 2025 cycles

    Checked by TSR

    Cite

    St Paul’s Girls’ School. Oxford offers: 29 of 65 applications from the school, 2025 admissions round. Status: Checked against the original. Source: University of Oxford: applications, offers and acceptances by applicant’s school (UCAS), annual 2024 and 2025 cycles, https://public.tableau.com/app/profile/sdma.oxford.university/viz/UniversityofOxford-AdmissionsStatistics2025UCASApplyCentre/UCASApplyCentre. Checked by The Schools Record on 15 October 2026. The Schools Record, https://theschoolsrecord.co.uk/evidence/fig:oxford_strict_st_paul_s_girls_school:19/

    Report a problem
Architectural illustration of St Paul’s Girls’ School
Generated illustration · credits
AI-generated architectural illustration with translucent colour wash made from photographic references; not a photograph, a commission or a measured survey. · Photograph reference
The school’s website
From the public record:spgs.org
Sixth-form qualifications
From the public record:A level 1992–2026 · Cambridge Pre-U 2017–2023 · Extended Project 2025
GCSE
From the public record:GCSE / IGCSE 1992–2026
Not yet checked against the school’s own site

To confirm with the school · compiled by us, not from a school document

Location
To confirm with the school:Hammersmith, London
Pupils admitted
To confirm with the school:Girls
Day or boarding
To confirm with the school:Day
Age range
To confirm with the school:11–18
Entry stages
To confirm with the school:11+ (Year 7), 16+ (Year 12)
Fees
Not in the record; ask the school

St Paul’s Girls’ School

Grading as before

Sixth form · A* or equivalent

2023–25

Grading returns to its pre-pandemic standard.

A* or equivalent: A-level A* and Pre-U D1 and D2, as a share of all entries.

All years and sources
SPGS: A* or equivalent rose from 42% in 2013 to 66.8% in 2025, over the 8 years we can compare.

Published by qualification2011 · A-level 49.5% at A*2010 · A-level 47.9% at A*Separate from the whole-year line.

  • Combined annual figure
  • Shown, not compared
  • Published qualification only · not joined
  • No whole-year figure
  • A level entries
  • Pre-U entries
  • Entry shares unknown

St Paul’s Girls’ School

This summer

Sixth form · A*–A or equivalent

2026

2026 results, as each school publishes them.

A*–A or equivalent: A-level A*–A and Pre-U D1 to D3, as a share of all entries.

All years and sources
SPGS: between 85.2% and 93.8% A*–A or equivalent in the 8 years we can compare, except 2022 (95.1%).

Published by qualification2011 · A-level 93.4% at A*–A2010 · A-level 92.4% at A*–ASeparate from the whole-year line.

  • Combined annual figure
  • Shown, not compared
  • Published qualification only · not joined
  • No whole-year figure
  • A level entries
  • Pre-U entries
  • Entry shares unknown

St Paul’s Girls’ School

Grading as before

Sixth form · A*–B or equivalent

2023–25

Grading returns to its pre-pandemic standard.

A*–B or equivalent: A-level A*–B and Pre-U D1 to M2, as a share of all entries.

All years and sources
SPGS: A*–B or equivalent fell from 98.3% in 2013 to 95.6% in 2025, over the 8 years we can compare.
  • Combined annual figure
  • Shown, not compared
  • No whole-year figure
  • A level entries
  • Pre-U entries
  • Entry shares unknown

St Paul’s Girls’ School

Lettered GCSEs

GCSE · A* / 9–8

2010–16

GCSEs are still graded from A* down to G.

A* (letter grades) or 9–8 (number grades), as a share of all entries.

All years and sources
SPGS: A* or 9–8 grades rose from 52.9% in 1994 to 93.6% in 2016, over the 16 years we can compare.

Published by qualification2026 · numbered GCSE 93.9% at 9 or 82025 · numbered GCSE 97.5% at 9 or 8Separate from the whole-year line.

  • Combined annual figure
  • Shown, not compared
  • Published qualification only · not joined
  • No whole-year figure
  • Lettered GCSE entries
  • Numbered GCSE entries
  • Entry shares unknown

St Paul’s Girls’ School

Lettered GCSEs

GCSE · A*–A / 9–7

2010–16

GCSEs are still graded from A* down to G. Ofqual aligned the bottom of grade 7 with the bottom of the old A.

A*–A / 9–7: A*–A on lettered GCSEs and 9 to 7 on numbered ones, as a share of all entries.

All years and sources
SPGS: A*–A or 9–7 grades rose from 85.0% in 1994 to 99.6% in 2016, over the 18 years we can compare.

Published by qualification2025 · numbered GCSE 99.6% at 9–72024 · numbered GCSE 98.4% at 9–7Separate from the whole-year line.

  • Combined annual figure
  • Shown, not compared
  • Published qualification only · not joined
  • No whole-year figure
  • Lettered GCSE entries
  • Numbered GCSE entries
  • Entry shares unknown

St Paul’s Girls’ School

Lettered GCSEs

GCSE · A*–C / 9–4

2010–16

GCSEs are still graded from A* down to G. Ofqual aligned the bottom of grade 4 with the bottom of the old C. At these schools it sits close to 100%, so it is not offered first in comparisons.

A*–C / 9–4: A*–C on lettered GCSEs and 9 to 4 on numbered ones, as a share of all entries.

All years and sources
SPGS: A*–C or 9–4 grades rose from 99.9% in 1995 to 100% in 2016, over the 14 years we can compare.

Published by qualification2025 · numbered GCSE 100% at 9–42023 · numbered GCSE 99.9% at 9–4Separate from the whole-year line.

  • Combined annual figure
  • Shown, not compared
  • A range
  • Published qualification only · not joined
  • No whole-year figure
  • Lettered GCSE entries
  • Numbered GCSE entries
  • Entry shares unknown

St Paul’s Girls’ School

Grading as before

GCSE · Grade 9

2023–25

Grading returns to its pre-pandemic standard. Grade 9 counts only entries graded 9–1; lettered GCSE entries are outside this figure.

Grade 9, as a share of entries graded 9–1 only. Lettered GCSE entries are excluded.

All years and sources
SPGS: between 81.9% and 84.7% grade 9 in the 5 years we can compare, except 2022 (85.8%).

Published by qualification2019 · numbered GCSE 85% at 9Separate from the whole-year line.

  • Grade 9
  • Shown, not compared
  • Published qualification only · not joined
  • No whole-year figure
  • Numbered GCSE entries
  • Entry shares unknown

Every year Sixth form · A* or equivalent

The 17 years covered here, newest first. Missing figures are explained alongside the results we have found. A* or equivalent: A-level A* and Pre-U D1 and D2, as a share of all entries.

St Paul’s Girls’ School: Sixth form · A* or equivalent, 2025 and 2026
YearGrades compared across qualificationsEntriesSPGS’s own figureStatusNoteSources
2026 · This summer · 2026 results, as each school publishes them.
2026 A* figure not recovered

Other grade bands: A*–A 89.1%

No figure SPGS’s 2026 A-level record gives 58.4% at A*, while a later check of the school’s results page found 60.3%. The difference is unresolved, so we do not plot an A* figure. Record and source
2023–25 · Grading as before · Grading returns to its pre-pandemic standard.
2025 66.8% 389 entries SPGS printed 66.8%, the same figure. Compared A level: SPGS provisional A-level results, as at 10 October 2025Source and calculation
How it adds up

SPGS printed 66.8% of 389 A-level entries at A*.

A level: subject results, 2025
Sixth form · A* or equivalent: 15 more years, 2010 to 2024
St Paul’s Girls’ School: Sixth form · A* or equivalent, 2010 to 2024
YearGrades compared across qualificationsEntriesSPGS’s own figureStatusNoteSources
2023–25 · Grading as before · Grading returns to its pre-pandemic standard.
2024 60.9% Not printed SPGS printed 60.9%, the same figure. Shown, not compared SPGS’s publications give different A-level figures for 2024. We show the figure but don’t compare it. Source and calculation
2023 55.0% 378 entries SPGS printed 53%, not the same as ours. Compared A level: St Paul's Girls' School 2023 final examination resultsPre-U: St Paul's Girls' School 2023 final examination resultsSource and calculation
How it adds up

207 of 376 A-level entries at A*, and 1 of 2 Pre-U entries at D1 or D2: 208 of 378 in all.

A level: A* 207 · A 125 · B 34 · C 10 · D 0 · E 0 · U 0 Pre-U: D1 1 · D2 0 · D3 0 · M1 1 · M2 0 · M3 0 · P1 0

A level: subject results, 2023Pre-U: subject results, 2023
2022 · The way back · Exams return, graded between the 2019 and 2021 standards.
2022 74.7% 367 entries SPGS printed 73.2% at A* (A level) and 80.6% at D1 or D2 (Pre-U). Compared Grades in 2022 were set at a midpoint between summer 2019 and 2021, on Ofqual’s account. Ofqual A level: St Paul's Girls' School 2022 provisional examination resultsPre-U: St Paul's Girls' School 2022 provisional examination resultsSource and calculation
How it adds up

216 of 295 A-level entries at A*, and 58 of 72 Pre-U entries at D1 or D2: 274 of 367 in all.

A level: A* 216 · A 62 · B 15 · C 2 · D 0 · E 0 · U 0 Pre-U: D1 40 · D2 18 · D3 13 · M1 1 · M2 0 · M3 0 · P1 0

A level: subject results, 2022Pre-U: subject results, 2022
2020–21 · No exams · Exams were cancelled. Teachers set the grades.
2021 87.5% 375 entries SPGS printed 88.4% at A* (A level) and 85% at D1 or D2 (Pre-U). Set by teachers Grades were set by teachers in 2021, not by exams. We show the figure but don’t compare it. A level: SPGS 2021 provisional A-level resultsPre-U: SPGS 2021 provisional Pre-U resultsSource and calculation
How it adds up

243 of 275 A-level entries at A*, and 85 of 100 Pre-U entries at D1 or D2: 328 of 375 in all.

A level: A* 243 · A 25 · B 5 · C 2 · D 0 · E 0 · U 0 Pre-U: D1 51 · D2 34 · D3 14 · M1 1 · M2 0 · M3 0 · P1 0

2020 64.8% 381 entries SPGS printed 60.4% at A* (A level) and 78.1% at D1 or D2 (Pre-U). Set by teachers Grades were set by teachers in 2020, not by exams. We show the figure but don’t compare it. A level: SPGS2020 provisional A-level and Pre-U resultsPre-U: SPGS2020 provisional A-level and Pre-U resultsSource and calculation
How it adds up

172 of 285 A-level entries at A*, and 75 of 96 Pre-U entries at D1 or D2: 247 of 381 in all.

A level: A* 172 · A 85 · B 22 · C 6 · D 0 · E 0 · U 0 Pre-U: D1 36 · D2 39 · D3 20 · M1 1 · M2 0 · M3 0 · P1 0

2017–19 · Reformed A levels · New two-year A levels, examined at the end, arrive from 2017.
2019 47.5% 396 entries SPGS printed 47.5%, the same as ours. Shown, not compared SPGS’s publications give different A-level figures for 2019. We show the figure but don’t compare it. A level: St Paul’s Girls’ School: A-level results 2019Pre-U: St Paul’s Girls’ School: Pre-U results 2019Source and calculation
How it adds up

132 of 304 A-level entries at A*, and 56 of 92 Pre-U entries at D1 or D2: 188 of 396 in all.

A level: A* 132 · A 117 · B 41 · C 11 · D 2 · E 1 · U 0

A level: subject results, 2019Pre-U: subject results, 2019
2018 61.9% 336 entries SPGS printed 58.7% at A* (A level) and 70.2% at D1 or D2 (Pre-U). Compared A level: SPGS2018 A-level and Pre-U resultsPre-U: SPGS2018 A-level and Pre-U resultsSource and calculation
How it adds up

142 of 242 A-level entries at A*, and 66 of 94 Pre-U entries at D1 or D2: 208 of 336 in all.

A level: A* 142 · A 72 · B 25 · C 3 · D 0 · E 0 · U 0 Pre-U: D1 29 · D2 37 · D3 23 · M1 2 · M2 2 · M3 1 · P1 0

A level: subject results, 2018Pre-U: subject results, 2018
2017 46.7% 392 entries SPGS printed 46.7%, the same as ours. Compared A level: St Paul’s Girls’ School: A-level results 2017Pre-U: SPGS2017 examination resultsSource and calculation
How it adds up

144 of 346 A-level entries at A*, and 39 of 46 Pre-U entries at D1 or D2: 183 of 392 in all.

A level: A* 144 · A 145 · B 47 · C 9 · D 1 · E 0 · U 0 Pre-U: D1 19 · D2 20 · D3 6 · M1 1 · M2 0 · M3 0 · P1 0

A level: subject results, 2017Pre-U: subject results, 2017
2010–16 · A* at A level · A levels gain an A* grade in 2010.
2016 60% 355 entries SPGS printed 60%, the same figure. Compared A level: St Paul’s Girls’ School: A-level results 2016Source and calculation
How it adds up

213 of 355 A-level entries at A*.

A level: A* 213 · A 120 · B 19 · C 2 · D 0 · E 1 · U 0

A level: subject results, 2016
2015 49.1% Not printed SPGS printed 49.1%, the same figure. Shown, not compared It isn’t clear exactly which entries SPGS’s figure counts. We show the figure but don’t compare it. A level: St Paul’s Girls’ School: report and accounts for the year ended 31 August 2015Source and calculation
2014 54.9% Not printed SPGS printed 54.9%, the same figure. Compared A level: St Paul’s Girls’ School: A-level results 2014Source and calculation
2013 42% 355 entries SPGS printed 42%, the same figure. Compared A level: SPGS Examination results, 23 September 2013Source and calculation
How it adds up

SPGS printed 42% of 355 A-level entries at A*.

A level: subject results, 2013
2012 49% Not printed SPGS printed 49%, the same figure. Shown, not compared It isn’t clear exactly which entries SPGS’s figure counts. We show the figure but don’t compare it. A level: St Paul’s Girls’ School: report and accounts for the year ended 31 August 2012Source and calculation
2011 A-level 49.5% at A*Results for individual qualifications; no combined annual figure
Published by qualification: 49.5% at A* (A-level). No whole-year figure is established. Qualification only We haven’t yet established which qualifications pupils took, so we cannot combine their results. A level: SPGS Examination results, archived November 2011Record and source
2010 A-level 47.9% at A*Results for individual qualifications; no combined annual figure
Published by qualification: 47.9% at A* (A-level). No whole-year figure is established. Qualification only We haven’t yet established which qualifications pupils took, so we cannot combine their results. A level: SPGS Examination results, archived November 2011Record and source

Every year Sixth form · A*–A or equivalent

The 17 years covered here, newest first. Missing figures are explained alongside the results we have found. A*–A or equivalent: A-level A*–A and Pre-U D1 to D3, as a share of all entries.

St Paul’s Girls’ School: Sixth form · A*–A or equivalent, 2026
YearGrades compared across qualificationsEntriesSPGS’s own figureStatusNoteSources
2026 · This summer · 2026 results, as each school publishes them.
2026 89.1% Not printed SPGS printed 89.1%, the same figure. Shown, not compared SPGS’s publications give different A-level figures for 2026. We show the figure but don’t compare it. Source and calculation
Sixth form · A*–A or equivalent: 16 more years, 2010 to 2025
St Paul’s Girls’ School: Sixth form · A*–A or equivalent, 2010 to 2025
YearGrades compared across qualificationsEntriesSPGS’s own figureStatusNoteSources
2023–25 · Grading as before · Grading returns to its pre-pandemic standard.
2025 88.7% 389 entries SPGS printed 88.7%, the same figure. Compared A level: SPGS provisional A-level results, as at 10 October 2025Source and calculation
How it adds up

SPGS printed 88.7% of 389 A-level entries at A*–A.

A level: subject results, 2025
2024 88.6% Not printed SPGS printed 88.6%, the same figure. Shown, not compared SPGS’s publications give different A-level figures for 2024. We show the figure but don’t compare it. Source and calculation
2023 88.1% 378 entries SPGS printed 87%, not the same as ours. Compared A level: St Paul's Girls' School 2023 final examination resultsPre-U: St Paul's Girls' School 2023 final examination resultsSource and calculation
How it adds up

332 of 376 A-level entries at A*–A, and 1 of 2 Pre-U entries at D1–D3: 333 of 378 in all.

A level: A* 207 · A 125 · B 34 · C 10 · D 0 · E 0 · U 0 Pre-U: D1 1 · D2 0 · D3 0 · M1 1 · M2 0 · M3 0 · P1 0

A level: subject results, 2023Pre-U: subject results, 2023
2022 · The way back · Exams return, graded between the 2019 and 2021 standards.
2022 95.1% 367 entries SPGS printed 94.2% at A*–A (A level) and 98.6% at D1–D3 (Pre-U). Compared Grades in 2022 were set at a midpoint between summer 2019 and 2021, on Ofqual’s account. Ofqual A level: St Paul's Girls' School 2022 provisional examination resultsPre-U: St Paul's Girls' School 2022 provisional examination resultsSource and calculation
How it adds up

278 of 295 A-level entries at A*–A, and 71 of 72 Pre-U entries at D1–D3: 349 of 367 in all.

A level: A* 216 · A 62 · B 15 · C 2 · D 0 · E 0 · U 0 Pre-U: D1 40 · D2 18 · D3 13 · M1 1 · M2 0 · M3 0 · P1 0

A level: subject results, 2022Pre-U: subject results, 2022
2020–21 · No exams · Exams were cancelled. Teachers set the grades.
2021 97.9% 375 entries SPGS printed 97.5% at A*–A (A level) and 99% at D1–D3 (Pre-U). Set by teachers Grades were set by teachers in 2021, not by exams. We show the figure but don’t compare it. A level: SPGS 2021 provisional A-level resultsPre-U: SPGS 2021 provisional Pre-U resultsSource and calculation
How it adds up

268 of 275 A-level entries at A*–A, and 99 of 100 Pre-U entries at D1–D3: 367 of 375 in all.

A level: A* 243 · A 25 · B 5 · C 2 · D 0 · E 0 · U 0 Pre-U: D1 51 · D2 34 · D3 14 · M1 1 · M2 0 · M3 0 · P1 0

2020 92.4% 381 entries SPGS printed 90.2% at A*–A (A level) and 99% at D1–D3 (Pre-U). Set by teachers Grades were set by teachers in 2020, not by exams. We show the figure but don’t compare it. A level: SPGS2020 provisional A-level and Pre-U resultsPre-U: SPGS2020 provisional A-level and Pre-U resultsSource and calculation
How it adds up

257 of 285 A-level entries at A*–A, and 95 of 96 Pre-U entries at D1–D3: 352 of 381 in all.

A level: A* 172 · A 85 · B 22 · C 6 · D 0 · E 0 · U 0 Pre-U: D1 36 · D2 39 · D3 20 · M1 1 · M2 0 · M3 0 · P1 0

2017–19 · Reformed A levels · New two-year A levels, examined at the end, arrive from 2017.
2019 84.6% 396 entries SPGS printed 84.6%, the same as ours. Shown, not compared SPGS’s publications give different A-level figures for 2019. We show the figure but don’t compare it. A level: St Paul’s Girls’ School: A-level results 2019Pre-U: St Paul’s Girls’ School: Pre-U results 2019Source and calculation
How it adds up

249 of 304 A-level entries at A*–A, and 86 of 92 Pre-U entries at D1–D3: 335 of 396 in all.

A level: A* 132 · A 117 · B 41 · C 11 · D 2 · E 1 · U 0

A level: subject results, 2019Pre-U: subject results, 2019
2018 90.2% 336 entries SPGS printed 88.4% at A*–A (A level) and 94.7% at D1–D3 (Pre-U). Compared A level: SPGS2018 A-level and Pre-U resultsPre-U: SPGS2018 A-level and Pre-U resultsSource and calculation
How it adds up

214 of 242 A-level entries at A*–A, and 89 of 94 Pre-U entries at D1–D3: 303 of 336 in all.

A level: A* 142 · A 72 · B 25 · C 3 · D 0 · E 0 · U 0 Pre-U: D1 29 · D2 37 · D3 23 · M1 2 · M2 2 · M3 1 · P1 0

A level: subject results, 2018Pre-U: subject results, 2018
2017 85.2% 392 entries SPGS printed 85.2%, the same as ours. Compared A level: St Paul’s Girls’ School: A-level results 2017Pre-U: SPGS2017 examination resultsSource and calculation
How it adds up

289 of 346 A-level entries at A*–A, and 45 of 46 Pre-U entries at D1–D3: 334 of 392 in all.

A level: A* 144 · A 145 · B 47 · C 9 · D 1 · E 0 · U 0 Pre-U: D1 19 · D2 20 · D3 6 · M1 1 · M2 0 · M3 0 · P1 0

A level: subject results, 2017Pre-U: subject results, 2017
2010–16 · A* at A level · A levels gain an A* grade in 2010.
2016 93.8% 355 entries SPGS printed 93.8%, the same figure. Compared A level: St Paul’s Girls’ School: A-level results 2016Source and calculation
How it adds up

333 of 355 A-level entries at A*–A.

A level: A* 213 · A 120 · B 19 · C 2 · D 0 · E 1 · U 0

A level: subject results, 2016
2015 87.5% Not printed SPGS printed 87.5%, the same figure. Shown, not compared It isn’t clear exactly which entries SPGS’s figure counts. We show the figure but don’t compare it. A level: St Paul’s Girls’ School: report and accounts for the year ended 31 August 2015Source and calculation
2014 91.3% Not printed SPGS printed 91.3%, the same figure. Compared A level: St Paul’s Girls’ School: A-level results 2014Source and calculation
2013 92.4% 355 entries SPGS printed 92.4%, the same figure. Compared A level: SPGS Examination results, 23 September 2013Source and calculation
How it adds up

SPGS printed 92.4% of 355 A-level entries at A*–A.

A level: subject results, 2013
2012 93% Not printed SPGS printed 93%, the same figure. Shown, not compared It isn’t clear exactly which entries SPGS’s figure counts. We show the figure but don’t compare it. A level: St Paul’s Girls’ School: report and accounts for the year ended 31 August 2012Source and calculation
2011 A-level 93.4% at A*–AResults for individual qualifications; no combined annual figure
Published by qualification: 93.4% at A*–A (A-level). No whole-year figure is established. Qualification only We haven’t yet established which qualifications pupils took, so we cannot combine their results. A level: SPGS Examination results, archived November 2011Record and source
2010 A-level 92.4% at A*–AResults for individual qualifications; no combined annual figure
Published by qualification: 92.4% at A*–A (A-level). No whole-year figure is established. Qualification only We haven’t yet established which qualifications pupils took, so we cannot combine their results. A level: SPGS Examination results, archived November 2011Record and source

Every year Sixth form · A*–B or equivalent

The 17 years covered here, newest first. Missing figures are explained alongside the results we have found. A*–B or equivalent: A-level A*–B and Pre-U D1 to M2, as a share of all entries.

St Paul’s Girls’ School: Sixth form · A*–B or equivalent, 2025 and 2026
YearGrades compared across qualificationsEntriesSPGS’s own figureStatusNoteSources
2026 · This summer · 2026 results, as each school publishes them.
2026 A*–B figure not recovered

Other grade bands: A*–A 89.1%

No figure SPGS’s 2026 A-level table doesn’t give A*–B on its own. Record and source
2023–25 · Grading as before · Grading returns to its pre-pandemic standard.
2025 95.6% 389 entries SPGS printed 95.6%, the same figure. Compared A level: SPGS provisional A-level results, as at 10 October 2025Source and calculation
How it adds up

SPGS printed 95.6% of 389 A-level entries at A*–B.

A level: subject results, 2025
Sixth form · A*–B or equivalent: 15 more years, 2010 to 2024
St Paul’s Girls’ School: Sixth form · A*–B or equivalent, 2010 to 2024
YearGrades compared across qualificationsEntriesSPGS’s own figureStatusNoteSources
2023–25 · Grading as before · Grading returns to its pre-pandemic standard.
2024 98.2% Not printed SPGS printed 98.2%, the same figure. Shown, not compared SPGS’s publications give different A-level figures for 2024. We show the figure but don’t compare it. Source and calculation
2023 97.4% 378 entries SPGS printed 97.1%, not the same as ours. Compared A level: St Paul's Girls' School 2023 final examination resultsPre-U: St Paul’s Girls’ School: Pre-U results 2023Source and calculation
How it adds up

366 of 376 A-level entries at A*–B, and 2 of 2 Pre-U entries at D1–M2: 368 of 378 in all.

A level: A* 207 · A 125 · B 34 · C 10 · D 0 · E 0 · U 0 Pre-U: D1 1 · D2 0 · D3 0 · M1 1 · M2 0 · M3 0 · P1 0

A level: subject results, 2023Pre-U: subject results, 2023
2022 · The way back · Exams return, graded between the 2019 and 2021 standards.
2022 99.5% 367 entries SPGS printed 99.3% at A*–B (A level) and 100% at D1–M2 (Pre-U). Compared Grades in 2022 were set at a midpoint between summer 2019 and 2021, on Ofqual’s account. Ofqual A level: St Paul's Girls' School 2022 provisional examination resultsPre-U: St Paul’s Girls’ School: Pre-U results 2022Source and calculation
How it adds up

293 of 295 A-level entries at A*–B, and 72 of 72 Pre-U entries at D1–M2: 365 of 367 in all.

A level: A* 216 · A 62 · B 15 · C 2 · D 0 · E 0 · U 0 Pre-U: D1 40 · D2 18 · D3 13 · M1 1 · M2 0 · M3 0 · P1 0

A level: subject results, 2022Pre-U: subject results, 2022
2020–21 · No exams · Exams were cancelled. Teachers set the grades.
2021 99.5% 375 entries SPGS printed 99.3% at A*–B (A level) and 100% at D1–M2 (Pre-U). Set by teachers Grades were set by teachers in 2021, not by exams. We show the figure but don’t compare it. A level: SPGS 2021 provisional A-level resultsPre-U: St Paul’s Girls’ School: Pre-U results 2021Source and calculation
How it adds up

273 of 275 A-level entries at A*–B, and 100 of 100 Pre-U entries at D1–M2: 373 of 375 in all.

A level: A* 243 · A 25 · B 5 · C 2 · D 0 · E 0 · U 0 Pre-U: D1 51 · D2 34 · D3 14 · M1 1 · M2 0 · M3 0 · P1 0

2020 98.4% 381 entries SPGS printed 97.9% at A*–B (A level) and 100% at D1–M2 (Pre-U). Set by teachers Grades were set by teachers in 2020, not by exams. We show the figure but don’t compare it. A level: SPGS2020 provisional A-level and Pre-U resultsPre-U: St Paul’s Girls’ School: Pre-U results 2020Source and calculation
How it adds up

279 of 285 A-level entries at A*–B, and 96 of 96 Pre-U entries at D1–M2: 375 of 381 in all.

A level: A* 172 · A 85 · B 22 · C 6 · D 0 · E 0 · U 0 Pre-U: D1 36 · D2 39 · D3 20 · M1 1 · M2 0 · M3 0 · P1 0

2017–19 · Reformed A levels · New two-year A levels, examined at the end, arrive from 2017.
2019 96.5% 396 entries SPGS printed 96.5%, the same as ours. Shown, not compared SPGS’s publications give different A-level figures for 2019. We show the figure but don’t compare it. A level: St Paul’s Girls’ School: A-level results 2019Pre-U: St Paul’s Girls’ School: Pre-U results 2019Source and calculation
How it adds up

290 of 304 A-level entries at A*–B, and 92 of 92 Pre-U entries at D1–M2: 382 of 396 in all.

A level: A* 132 · A 117 · B 41 · C 11 · D 2 · E 1 · U 0

A level: subject results, 2019Pre-U: subject results, 2019
2018 98.8% 336 entries SPGS printed 98.8% at A*–B (A level) and 98.9% at D1–M2 (Pre-U). Compared A level: SPGS2018 A-level and Pre-U resultsPre-U: SPGS2018 A-level and Pre-U resultsSource and calculation
How it adds up

239 of 242 A-level entries at A*–B, and 93 of 94 Pre-U entries at D1–M2: 332 of 336 in all.

A level: A* 142 · A 72 · B 25 · C 3 · D 0 · E 0 · U 0 Pre-U: D1 29 · D2 37 · D3 23 · M1 2 · M2 2 · M3 1 · P1 0

A level: subject results, 2018Pre-U: subject results, 2018
2017 97.4% 392 entries SPGS printed 97.4%, the same as ours. Compared A level: St Paul’s Girls’ School: A-level results 2017Pre-U: St Paul’s Girls’ School: Pre-U results 2017Source and calculation
How it adds up

336 of 346 A-level entries at A*–B, and 46 of 46 Pre-U entries at D1–M2: 382 of 392 in all.

A level: A* 144 · A 145 · B 47 · C 9 · D 1 · E 0 · U 0 Pre-U: D1 19 · D2 20 · D3 6 · M1 1 · M2 0 · M3 0 · P1 0

A level: subject results, 2017Pre-U: subject results, 2017
2010–16 · A* at A level · A levels gain an A* grade in 2010.
2016 99.2% 355 entries SPGS printed 99.2%, the same figure. Compared A level: SPGS2016 FINAL A-level examination resultsSource and calculation
How it adds up

352 of 355 A-level entries at A*–B.

A level: A* 213 · A 120 · B 19 · C 2 · D 0 · E 1 · U 0

A level: subject results, 2016
2015 98.9% Not printed SPGS printed 98.9%, the same figure. Shown, not compared It isn’t clear exactly which entries SPGS’s figure counts. We show the figure but don’t compare it. A level: St Paul’s Girls’ School: report and accounts for the year ended 31 August 2015Source and calculation
2014 98.9% Not printed SPGS printed 98.9%, the same figure. Compared A level: St Paul’s Girls’ School: A-level results 2014Source and calculation
2013 98.3% 355 entries SPGS printed 98.3%, the same figure. Compared A level: SPGS Examination results, 23 September 2013Source and calculation
How it adds up

SPGS printed 98.3% of 355 A-level entries at A*–B.

A level: subject results, 2013
2012 A*–B figure not recovered

Other grade bands: A* 49%A*–A 93%

No figure SPGS’s 2012 A-level table doesn’t give A*–B on its own. A level: St Paul’s Girls’ School: report and accounts for the year ended 31 August 2012Record and source
2011 A*–B figure not recovered
No figure We haven’t yet established which qualifications pupils took, so we cannot combine their results. A level: SPGS Examination results, archived November 2011Record and source
2010 A*–B figure not recovered
No figure We haven’t yet established which qualifications pupils took, so we cannot combine their results. Record and source

Every year GCSE · A* / 9–8

The 33 years covered here, newest first. Missing figures are explained alongside the results we have found. A* (letter grades) or 9–8 (number grades), as a share of all entries.

St Paul’s Girls’ School: GCSE · A* / 9–8, 2016 to 2026
YearGrades compared across qualificationsEntriesSPGS’s own figureStatusNoteSources
2026 · This summer · 2026 results, as each school publishes them.
2026 numbered GCSE 93.9% at 9 or 8Results for individual qualifications; no combined annual figure
Published by qualification: 93.9% at 9 or 8 (numbered GCSE). No whole-year figure is established. Qualification only SPGS reported 93.9% at grades 9–8 for 2026 without an entry count. We also lack a whole-school figure for its lettered GCSEs, so we cannot combine the two grading scales. Record and source
2023–25 · Grading as before · Grading returns to its pre-pandemic standard.
2025 numbered GCSE 97.5% at 9 or 8Results for individual qualifications; no combined annual figure

Other grade bands: Grade 9 84.7%

Published by qualification: 97.5% at 9 or 8 (numbered GCSE). No whole-year figure is established. Qualification only We don’t have SPGS’s whole-school lettered GCSE figure for 2025, so we cannot give a combined annual figure. 9–1: SPGS 2025 provisional GCSE/IGCSE results: numbered gradesRecord and source
2024 numbered GCSE 94.8% at 9 or 8Results for individual qualifications; no combined annual figure

Other grade bands: Grade 9 83.6%

SPGS printed 94.7%, not compared. Published by qualification: 94.8% at 9 or 8 (numbered GCSE). No whole-year figure is established. Qualification only We don’t have SPGS’s whole-school lettered GCSE figure for 2024, so we cannot give a combined annual figure. 9–1: SPGS 2024 provisional GCSE/IGCSE results: numbered gradesRecord and source
2023 numbered GCSE 95% at 9 or 8Results for individual qualifications; no combined annual figure

Other grade bands: Grade 9 81.9%

Published by qualification: 95% at 9 or 8 (numbered GCSE). No whole-year figure is established. Qualification only We don’t have SPGS’s whole-school lettered GCSE figure for 2023, so we cannot give a combined annual figure. 9–1: St Paul’s Girls’ School: GCSE/IGCSE results 2023Record and source
2022 · The way back · Exams return, graded between the 2019 and 2021 standards.
2022 numbered GCSE 95% at 9 or 8Results for individual qualifications; no combined annual figure

Other grade bands: Grade 9 85.8%

Published by qualification: 95% at 9 or 8 (numbered GCSE). No whole-year figure is established. Qualification only We don’t have SPGS’s whole-school lettered GCSE figure for 2022, so we cannot give a combined annual figure. Grades in 2022 were set at a midpoint between summer 2019 and 2021, on Ofqual’s account. Ofqual 9–1: SPGS 2022 GCSE/IGCSE results: numbered gradesRecord and source
2020–21 · No exams · Exams were cancelled. Teachers set the grades.
2021 numbered GCSE 97.4% at 9 or 8Results for individual qualifications; no combined annual figure

Other grade bands: Grade 9 89%

Published by qualification: 97.4% at 9 or 8 (numbered GCSE). No whole-year figure is established. Qualification only Grades were set by teachers. We don’t have SPGS’s whole-school lettered GCSE figure for 2021, so we cannot give a combined annual figure. 9–1: SPGS 2021 provisional GCSE/IGCSE results: numbered gradesRecord and source
2020 numbered GCSE 98.2% at 9 or 8Results for individual qualifications; no combined annual figure

Other grade bands: Grade 9 86%

Published by qualification: 98.2% at 9 or 8 (numbered GCSE). No whole-year figure is established. Qualification only Grades were set by teachers. We don’t have SPGS’s whole-school lettered GCSE figure for 2020, so we cannot give a combined annual figure. 9–1: SPGS 2020 GCSE/IGCSE provisional results: numbered gradesRecord and source
2017–19 · Numbers arrive · GCSEs move to grades 9 to 1, English and maths first, in 2017.
2019 numbered GCSE 96.4% at 9 or 8Results for individual qualifications; no combined annual figure
Published by qualification: 96.4% at 9 or 8 (numbered GCSE). No whole-year figure is established. Qualification only We haven’t confirmed which qualifications pupils took, so we cannot combine their results. 9–1: SPGS2019 GCSE/IGCSE examination results: grades9–1Record and source
2018 numbered GCSE 97% at 9 or 8Results for individual qualifications; no combined annual figure

Other grade bands: Grade 9 83.4%

Published by qualification: 97% at 9 or 8 (numbered GCSE). No whole-year figure is established. Qualification only We don’t have SPGS’s whole-school lettered GCSE figure for 2018, so we cannot give a combined annual figure. 9–1: SPGS 2018 GCSE and IGCSE results: numbered gradesRecord and source
2017 lettered GCSE 91.7% at A*Results for individual qualifications; no combined annual figure
Published by qualification: 91.7% at A* (lettered GCSE). No whole-year figure is established. Qualification only SPGS’s 2017 table prints more grades than entries, so its figures don’t add up. A*–G: SPGS2017 GCSE/IGCSE examination resultsRecord and source
2010–16 · Lettered GCSEs · GCSEs are still graded from A* down to G.
2016 93.6% 1,032 entries SPGS printed 93.6%, the same figure. Compared A*–G: SPGS2016 FINAL I/GCSE examination resultsSource and calculation
How it adds up

966 of 1,032 lettered GCSE entries at A*.

Lettered GCSE: A* 966 · A 62 · B 4 · C 0 · D 0

A*–G: subject results, 2016
GCSE · A* / 9–8: 22 more years, 1994 to 2015
St Paul’s Girls’ School: GCSE · A* / 9–8, 1994 to 2015
YearGrades compared across qualificationsEntriesSPGS’s own figureStatusNoteSources
2010–16 · Lettered GCSEs · GCSEs are still graded from A* down to G.
2015 90% 1,092 entries SPGS printed 90%, the same figure. Compared A*–G: SPGS2015 I/GCSE examination resultsSource and calculation
How it adds up

983 of 1,092 lettered GCSE entries at A*.

Lettered GCSE: A* 983 · A 97 · B 10 · C 0 · D 2

A*–G: subject results, 2015
2014 A* figure not recovered

Other grade bands: A*–C / 9–4 100%

No figure SPGS’s 2014 lettered GCSE table doesn’t give A* on its own. Record and source
2013 91.2% Not printed SPGS printed 91.2%, the same figure. Compared A*–G: St Paul’s Girls’ School: GCSE/IGCSE results 2013Source and calculation
2012 A* figure not recovered

Other grade bands: A*–A / 9–7 98%

No figure SPGS’s 2012 lettered GCSE table doesn’t give A* on its own. A*–G: St Paul’s Girls’ School: report and accounts for the year ended 31 August 2012Record and source
2011 81.4% Not printed SPGS printed 81.4%, the same figure. Compared A*–G: SPGS Examination results, archived November 2011Source and calculation
2010 84% Not printed SPGS printed 84%, the same figure. Compared A*–G: St Paul’s Girls’ School: GCSE/IGCSE results 2010Source and calculation
1994–2009 · The A* arrives · GCSE’s A* grade is first awarded in 1994.
2009 77.2% 914 entries SPGS printed 77.2%, the same figure. Compared A*–G: St Paul’s Girls’ School: GCSE/IGCSE results 2009Source and calculation
How it adds up

706 of 914 lettered GCSE entries at A*.

A*–G: subject results, 2009
2008 81.5% 881 entries SPGS printed 81.5%, the same figure. Shown, not compared The year of the table it comes from is worked out, not printed. We show the figure but don’t compare it. A*–G: SPGS Results, page captured 1 December 2008Source and calculation
How it adds up

718 of 881 lettered GCSE entries at A*.

A*–G: subject results, 2008
2007 86% 908 entries SPGS printed 86%, the same figure. Compared A*–G: St Paul’s Girls’ School: GCSE/IGCSE results 2007Source and calculation
How it adds up

781 of 908 lettered GCSE entries at A*.

A*–G: subject results, 2007
2006 71.7% 901 entries SPGS printed 71.7%, the same figure. Compared A*–G: ISC 2006 examination results: GCSEResultsFinal20061002Source and calculation
How it adds up

646 of 901 lettered GCSE entries at A*.

Lettered GCSE: A* 646 · A 215 · B 38 · C 2 · D 0

A*–G: subject results, 2006
2005 66.8% 805 entries SPGS printed 66.8%, the same figure. Compared A*–G: ISC GCSE results 2005 — St Paul’s Girls’ SchoolSource and calculation
How it adds up

538 of 805 lettered GCSE entries at A*.

Lettered GCSE: A* 538 · A 239 · B 28

A*–G: subject results, 2005
2004 76.4% 856 entries SPGS printed 76.4%, the same figure. Compared A*–G: ISC GCSE results 2004 — St Paul’s Girls’ SchoolSource and calculation
How it adds up

654 of 856 lettered GCSE entries at A*.

Lettered GCSE: A* 654 · A 168 · B 30 · C 4

A*–G: subject results, 2004
2003 78.8% 886 entries SPGS printed 78.8%, the same figure. Compared A*–G: SPGS GCE and GCSE June2003 analysis: GCSE Level 6thSource and calculation
How it adds up

698 of 886 lettered GCSE entries at A*.

A*–G: subject results, 2003
2002 73.4% 816 entries SPGS printed 73.4%, the same figure. Compared A*–G: ISC GCSE results 2002 — St Paul’s Girls’ SchoolSource and calculation
How it adds up

599 of 816 lettered GCSE entries at A*.

Lettered GCSE: A* 599 · A 167 · B 40 · C 9 · D 1

A*–G: subject results, 2002
2001 75.3% 861 entries SPGS printed 75.3%, the same figure. Compared A*–G: ISC GCSE results 2001 — St Paul’s Girls’ SchoolSource and calculation
How it adds up

648 of 861 lettered GCSE entries at A*.

Lettered GCSE: A* 648 · A 184 · B 28 · C 1

A*–G: subject results, 2001
2000 A* figure not recovered
No figure We have found SPGS’s 2000 GCSE results, but not as percentages covering all subject entries. The result cannot be included in this comparison.
1999 A* figure not recovered
No figure We haven’t searched for SPGS’s 1999 GCSE results yet.
1998 64.1% Not printed SPGS printed 64.1%, the same figure. Compared A*–G: The Times GCSE results, 5 Sep 1998Source and calculation
1997 60.3% Not printed SPGS printed 60.3%, the same figure. Compared A*–G: The Times GCSE School League TablesSource and calculation
1996 A* figure not recovered

Other grade bands: A*–C / 9–4 100%

No figure SPGS’s 1996 lettered GCSE table doesn’t give A* on its own. A*–G: St Paul’s Girls’ School: GCSE results 1996Record and source
1995 A* figure not recovered No figure SPGS’s 1995 lettered GCSE table doesn’t give A* on its own. A*–G: Eton College GCSE 1995 — school final resultsRecord and source
1994 52.9% Not printed SPGS printed 52.9%, the same figure. Compared A*–G: The Times GCSE results, 3 Sep 1994Source and calculation

Every year GCSE · A*–A / 9–7

The 33 years covered here, newest first. Missing figures are explained alongside the results we have found. A*–A / 9–7: A*–A on lettered GCSEs and 9 to 7 on numbered ones, as a share of all entries.

St Paul’s Girls’ School: GCSE · A*–A / 9–7, 2016 to 2026
YearGrades compared across qualificationsEntriesSPGS’s own figureStatusNoteSources
2026 · This summer · 2026 results, as each school publishes them.
2026 A*–A / 9–7 figure not recovered
SPGS printed 98.5%, not compared. No figure SPGS’s 2026 numbered GCSE table doesn’t give 9–7 on its own. We don’t have SPGS’s whole-school lettered GCSE figure for 2026. Record and source
2023–25 · Grading as before · Grading returns to its pre-pandemic standard.
2025 numbered GCSE 99.6% at 9–7Results for individual qualifications; no combined annual figure

Other grade bands: Grade 9 84.7%

Published by qualification: 99.6% at 9–7 (numbered GCSE). No whole-year figure is established. Qualification only We don’t have SPGS’s whole-school lettered GCSE figure for 2025, so we cannot give a combined annual figure. 9–1: SPGS 2025 provisional GCSE/IGCSE results: numbered gradesRecord and source
2024 numbered GCSE 98.4% at 9–7Results for individual qualifications; no combined annual figure

Other grade bands: Grade 9 83.6%

SPGS printed 98.5%, not compared. Published by qualification: 98.4% at 9–7 (numbered GCSE). No whole-year figure is established. Qualification only We don’t have SPGS’s whole-school lettered GCSE figure for 2024, so we cannot give a combined annual figure. 9–1: SPGS 2024 provisional GCSE/IGCSE results: numbered gradesRecord and source
2023 numbered GCSE 99% at 9–7Results for individual qualifications; no combined annual figure

Other grade bands: Grade 9 81.9%

Published by qualification: 99% at 9–7 (numbered GCSE). No whole-year figure is established. Qualification only We don’t have SPGS’s whole-school lettered GCSE figure for 2023, so we cannot give a combined annual figure. 9–1: St Paul’s Girls’ School: GCSE/IGCSE results 2023Record and source
2022 · The way back · Exams return, graded between the 2019 and 2021 standards.
2022 numbered GCSE 98.4% at 9–7Results for individual qualifications; no combined annual figure

Other grade bands: Grade 9 85.8%

Published by qualification: 98.4% at 9–7 (numbered GCSE). No whole-year figure is established. Qualification only We don’t have SPGS’s whole-school lettered GCSE figure for 2022, so we cannot give a combined annual figure. Grades in 2022 were set at a midpoint between summer 2019 and 2021, on Ofqual’s account. Ofqual 9–1: SPGS 2022 GCSE/IGCSE results: numbered gradesRecord and source
2020–21 · No exams · Exams were cancelled. Teachers set the grades.
2021 numbered GCSE 99.8% at 9–7Results for individual qualifications; no combined annual figure

Other grade bands: Grade 9 89%

Published by qualification: 99.8% at 9–7 (numbered GCSE). No whole-year figure is established. Qualification only Grades were set by teachers. We don’t have SPGS’s whole-school lettered GCSE figure for 2021, so we cannot give a combined annual figure. 9–1: SPGS 2021 provisional GCSE/IGCSE results: numbered gradesRecord and source
2020 numbered GCSE 100% at 9–7Results for individual qualifications; no combined annual figure

Other grade bands: Grade 9 86%

Published by qualification: 100% at 9–7 (numbered GCSE). No whole-year figure is established. Qualification only Grades were set by teachers. We don’t have SPGS’s whole-school lettered GCSE figure for 2020, so we cannot give a combined annual figure. 9–1: SPGS 2020 GCSE/IGCSE provisional results: numbered gradesRecord and source
2017–19 · Numbers arrive · GCSEs move to grades 9 to 1, English and maths first, in 2017.
2019 numbered GCSE 99.5% at 9–7Results for individual qualifications; no combined annual figure
Published by qualification: 99.5% at 9–7 (numbered GCSE). No whole-year figure is established. Qualification only We haven’t confirmed which qualifications pupils took, so we cannot combine their results. 9–1: SPGS2019 GCSE/IGCSE examination results: grades9–1Record and source
2018 numbered GCSE 100% at 9–7Results for individual qualifications; no combined annual figure

Other grade bands: Grade 9 83.4%

Published by qualification: 100% at 9–7 (numbered GCSE). No whole-year figure is established. Qualification only We don’t have SPGS’s whole-school lettered GCSE figure for 2018, so we cannot give a combined annual figure. 9–1: SPGS 2018 GCSE and IGCSE results: numbered gradesRecord and source
2017 lettered GCSE 99.3% at A*–AResults for individual qualifications; no combined annual figure
Published by qualification: 99.3% at A*–A (lettered GCSE). No whole-year figure is established. Qualification only SPGS’s 2017 table prints more grades than entries, so its figures don’t add up. A*–G: SPGS2017 GCSE/IGCSE examination resultsRecord and source
2010–16 · Lettered GCSEs · GCSEs are still graded from A* down to G.
2016 99.6% 1,032 entries SPGS printed 99.6%, the same figure. Compared A*–G: SPGS2016 FINAL I/GCSE examination resultsSource and calculation
How it adds up

1,028 of 1,032 lettered GCSE entries at A*–A.

Lettered GCSE: A* 966 · A 62 · B 4 · C 0 · D 0

A*–G: subject results, 2016
GCSE · A*–A / 9–7: 22 more years, 1994 to 2015
St Paul’s Girls’ School: GCSE · A*–A / 9–7, 1994 to 2015
YearGrades compared across qualificationsEntriesSPGS’s own figureStatusNoteSources
2010–16 · Lettered GCSEs · GCSEs are still graded from A* down to G.
2015 98.9% 1,092 entries SPGS printed 98.9%, the same figure. Compared A*–G: SPGS2015 I/GCSE examination resultsSource and calculation
How it adds up

1,080 of 1,092 lettered GCSE entries at A*–A.

Lettered GCSE: A* 983 · A 97 · B 10 · C 0 · D 2

A*–G: subject results, 2015
2014 A*–A figure not recovered

Other grade bands: A*–C / 9–4 100%

No figure SPGS’s 2014 lettered GCSE table doesn’t give A*–A on its own. Record and source
2013 99.4% Not printed SPGS printed 99.4%, the same figure. Compared A*–G: St Paul’s Girls’ School: GCSE/IGCSE results 2013Source and calculation
2012 98% Not printed SPGS printed 98%, the same figure. Compared A*–G: St Paul’s Girls’ School: report and accounts for the year ended 31 August 2012Source and calculation
2011 98.0% Not printed SPGS printed 98.02% at A*–A. Compared A*–G: SPGS Examination results, archived November 2011Source and calculation
2010 99.1% Not printed SPGS printed 99.1%, the same figure. Compared A*–G: St Paul’s Girls’ School: GCSE/IGCSE results 2010Source and calculation
1994–2009 · The A* arrives · GCSE’s A* grade is first awarded in 1994.
2009 97.3% 914 entries SPGS printed 97.3%, the same figure. Compared A*–G: St Paul’s Girls’ School: GCSE/IGCSE results 2009Source and calculation
How it adds up

889 of 914 lettered GCSE entries at A*–A.

A*–G: subject results, 2009
2008 96.9% 881 entries Shown, not compared The year of the table it comes from is worked out, not printed. We show the figure but don’t compare it. A*–G: SPGS Results, page captured 1 December 2008Source and calculation
How it adds up

854 of 881 lettered GCSE entries at A*–A.

A*–G: subject results, 2008
2007 99% 908 entries SPGS printed 99%, the same figure. Compared A*–G: St Paul’s Girls’ School: GCSE/IGCSE results 2007Source and calculation
How it adds up

899 of 908 lettered GCSE entries at A*–A.

A*–G: subject results, 2007
2006 95.6% 901 entries SPGS printed 95.56% at A*–A. Compared A*–G: ISC 2006 examination results: GCSEResultsFinal20061002Source and calculation
How it adds up

861 of 901 lettered GCSE entries at A*–A.

Lettered GCSE: A* 646 · A 215 · B 38 · C 2 · D 0

A*–G: subject results, 2006
2005 96.5% 805 entries SPGS printed 96.5%, the same figure. Compared A*–G: ISC GCSE results 2005 — St Paul’s Girls’ SchoolSource and calculation
How it adds up

777 of 805 lettered GCSE entries at A*–A.

Lettered GCSE: A* 538 · A 239 · B 28

A*–G: subject results, 2005
2004 96.0% 856 entries SPGS printed 96.0%, the same figure. Compared A*–G: ISC GCSE results 2004 — St Paul’s Girls’ SchoolSource and calculation
How it adds up

822 of 856 lettered GCSE entries at A*–A.

Lettered GCSE: A* 654 · A 168 · B 30 · C 4

A*–G: subject results, 2004
2003 97.1% 886 entries SPGS printed 97.1%, the same figure. Compared A*–G: SPGS GCE and GCSE June2003 analysis: GCSE Level 6thSource and calculation
How it adds up

SPGS printed 97.1% of 886 lettered GCSE entries at A*–A.

A*–G: subject results, 2003
2002 93.9% 816 entries SPGS printed 93.9%, the same figure. Compared A*–G: ISC GCSE results 2002 — St Paul’s Girls’ SchoolSource and calculation
How it adds up

766 of 816 lettered GCSE entries at A*–A.

Lettered GCSE: A* 599 · A 167 · B 40 · C 9 · D 1

A*–G: subject results, 2002
2001 96.6% 861 entries SPGS printed 96.6%, the same figure. Compared A*–G: ISC GCSE results 2001 — St Paul’s Girls’ SchoolSource and calculation
How it adds up

832 of 861 lettered GCSE entries at A*–A.

Lettered GCSE: A* 648 · A 184 · B 28 · C 1

A*–G: subject results, 2001
2000 A*–A figure not recovered
No figure We have found SPGS’s 2000 GCSE results, but not as percentages covering all subject entries. The result cannot be included in this comparison.
1999 A*–A figure not recovered
No figure We haven’t searched for SPGS’s 1999 GCSE results yet.
1998 97.4% Not printed SPGS printed 97.4%, the same figure. Compared A*–G: The Times GCSE results, 5 Sep 1998Source and calculation
1997 95.1% Not printed SPGS printed 95.1%, the same figure. Compared A*–G: The Times GCSE School League TablesSource and calculation
1996 A*–A figure not recovered

Other grade bands: A*–C / 9–4 100%

No figure SPGS’s 1996 lettered GCSE table doesn’t give A*–A on its own. A*–G: St Paul’s Girls’ School: GCSE results 1996Record and source
1995 85.7% Not printed SPGS printed 85.67% at A*–A. Compared A*–G: St Paul’s Girls’ School: GCSE results 1995Source and calculation
1994 85.0% Not printed SPGS printed 85.0%, the same figure. Compared A*–G: The Times GCSE results, 3 Sep 1994Source and calculation

Every year GCSE · A*–C / 9–4

The 33 years covered here, newest first. Missing figures are explained alongside the results we have found. A*–C / 9–4: A*–C on lettered GCSEs and 9 to 4 on numbered ones, as a share of all entries.

St Paul’s Girls’ School: GCSE · A*–C / 9–4, 2016 to 2026
YearGrades compared across qualificationsEntriesSPGS’s own figureStatusNoteSources
2026 · This summer · 2026 results, as each school publishes them.
2026 A*–C / 9–4 figure not recovered
No figure SPGS’s 2026 numbered GCSE table doesn’t give 9–4 on its own. We don’t have SPGS’s whole-school lettered GCSE figure for 2026. Record and source
2023–25 · Grading as before · Grading returns to its pre-pandemic standard.
2025 numbered GCSE 100% at 9–4Results for individual qualifications; no combined annual figure

Other grade bands: Grade 9 84.7%

Published by qualification: 100% at 9–4 (numbered GCSE). No whole-year figure is established. Qualification only We don’t have SPGS’s whole-school lettered GCSE figure for 2025, so we cannot give a combined annual figure. 9–1: St Paul’s Girls’ School: GCSE/IGCSE results 2025Record and source
2024 A*–C / 9–4 figure not recovered

Other grade bands: Grade 9 83.6%

No figure We don’t have SPGS’s whole-school lettered GCSE figure for 2024, so we cannot give a combined annual figure. 9–1: St Paul’s Girls’ School: GCSE/IGCSE results 2024Record and source
2023 numbered GCSE 99.9% at 9–4Results for individual qualifications; no combined annual figure

Other grade bands: Grade 9 81.9%

Published by qualification: 99.9% at 9–4 (numbered GCSE). No whole-year figure is established. Qualification only We don’t have SPGS’s whole-school lettered GCSE figure for 2023, so we cannot give a combined annual figure. 9–1: St Paul’s Girls’ School: GCSE/IGCSE results 2023Record and source
2022 · The way back · Exams return, graded between the 2019 and 2021 standards.
2022 numbered GCSE 100% at 9–4Results for individual qualifications; no combined annual figure

Other grade bands: Grade 9 85.8%

Published by qualification: 100% at 9–4 (numbered GCSE). No whole-year figure is established. Qualification only We don’t have SPGS’s whole-school lettered GCSE figure for 2022, so we cannot give a combined annual figure. Grades in 2022 were set at a midpoint between summer 2019 and 2021, on Ofqual’s account. Ofqual 9–1: St Paul’s Girls’ School: GCSE/IGCSE results 2022Record and source
2020–21 · No exams · Exams were cancelled. Teachers set the grades.
2021 numbered GCSE 100% at 9–4Results for individual qualifications; no combined annual figure

Other grade bands: Grade 9 89%

Published by qualification: 100% at 9–4 (numbered GCSE). No whole-year figure is established. Qualification only Grades were set by teachers. We don’t have SPGS’s whole-school lettered GCSE figure for 2021, so we cannot give a combined annual figure. 9–1: St Paul’s Girls’ School: GCSE/IGCSE results 2021Record and source
2020 numbered GCSE 100% at 9–4Results for individual qualifications; no combined annual figure

Other grade bands: Grade 9 86%

Published by qualification: 100% at 9–4 (numbered GCSE). No whole-year figure is established. Qualification only Grades were set by teachers. We don’t have SPGS’s whole-school lettered GCSE figure for 2020, so we cannot give a combined annual figure. 9–1: St Paul’s Girls’ School: GCSE/IGCSE results 2020Record and source
2017–19 · Numbers arrive · GCSEs move to grades 9 to 1, English and maths first, in 2017.
2019 numbered GCSE 100% at 9–4Results for individual qualifications; no combined annual figure
Published by qualification: 100% at 9–4 (numbered GCSE). No whole-year figure is established. Qualification only We haven’t confirmed which qualifications pupils took, so we cannot combine their results. 9–1: St Paul’s Girls’ School: GCSE/IGCSE results 2019Record and source
2018 numbered GCSE 100% at 9–4Results for individual qualifications; no combined annual figure

Other grade bands: Grade 9 83.4%

Published by qualification: 100% at 9–4 (numbered GCSE). No whole-year figure is established. Qualification only We don’t have SPGS’s whole-school lettered GCSE figure for 2018, so we cannot give a combined annual figure. 9–1: St Paul’s Girls’ School: GCSE/IGCSE results 2018Record and source
2017 A*–C / 9–4 figure not recovered
No figure SPGS’s 2017 table prints more grades than entries, so its figures don’t add up. A*–G: SPGS2017 GCSE/IGCSE examination resultsRecord and source
2010–16 · Lettered GCSEs · GCSEs are still graded from A* down to G.
2016 100% 1,032 entries SPGS printed 100%, the same figure. Compared A*–G: St Paul’s Girls’ School: GCSE/IGCSE results 2016Source and calculation
How it adds up

1,032 of 1,032 lettered GCSE entries at A*–C.

Lettered GCSE: A* 966 · A 62 · B 4 · C 0 · D 0

A*–G: subject results, 2016
GCSE · A*–C / 9–4: 22 more years, 1994 to 2015
St Paul’s Girls’ School: GCSE · A*–C / 9–4, 1994 to 2015
YearGrades compared across qualificationsEntriesSPGS’s own figureStatusNoteSources
2010–16 · Lettered GCSEs · GCSEs are still graded from A* down to G.
2015 99.8% 1,092 entries SPGS printed 99.8%, the same figure. Compared A*–G: St Paul’s Girls’ School: GCSE/IGCSE results 2015Source and calculation
How it adds up

1,090 of 1,092 lettered GCSE entries at A*–C.

Lettered GCSE: A* 983 · A 97 · B 10 · C 0 · D 2

A*–G: subject results, 2015
2014 100% Not printed SPGS printed 100%, the same figure. Compared A*–G: St Paul’s Girls’ School: GCSE/IGCSE results 2014Source and calculation
2013 100% Not printed SPGS printed 100%, the same figure. Compared A*–G: St Paul’s Girls’ School: GCSE/IGCSE results 2013Source and calculation
2012 A*–C figure not recovered

Other grade bands: A*–A / 9–7 98%

No figure SPGS’s 2012 lettered GCSE table doesn’t give A*–C on its own. A*–G: St Paul’s Girls’ School: report and accounts for the year ended 31 August 2012Record and source
2011 A*–C figure not recovered No figure SPGS’s 2011 lettered GCSE table doesn’t give A*–C on its own. A*–G: SPGS Examination results, archived November 2011Record and source
2010 A*–C figure not recovered No figure SPGS’s 2010 lettered GCSE table doesn’t give A*–C on its own. A*–G: St Paul’s Girls’ School: GCSE/IGCSE results 2010Record and source
1994–2009 · The A* arrives · GCSE’s A* grade is first awarded in 1994.
2009 100% 914 entries SPGS printed 100%, the same figure. Compared A*–G: St Paul’s Girls’ School: GCSE/IGCSE results 2009Source and calculation
How it adds up

914 of 914 lettered GCSE entries at A*–C.

A*–G: subject results, 2009
2008 100.0% 881 entries Shown, not compared The year of the table it comes from is worked out, not printed. We show the figure but don’t compare it. A*–G: SPGS Results, page captured 1 December 2008Source and calculation
How it adds up

881 of 881 lettered GCSE entries at A*–C.

A*–G: subject results, 2008
2007 100% 908 entries SPGS printed 100%, the same figure. Compared A*–G: St Paul’s Girls’ School: GCSE/IGCSE results 2007Source and calculation
How it adds up

908 of 908 lettered GCSE entries at A*–C.

A*–G: subject results, 2007
2006 100% 901 entries SPGS printed 100%, the same figure. Compared A*–G: ISC 2006 examination results: GCSEResultsFinal20061002Source and calculation
How it adds up

901 of 901 lettered GCSE entries at A*–C.

Lettered GCSE: A* 646 · A 215 · B 38 · C 2 · D 0

A*–G: subject results, 2006
2005 100.0% 805 entries Compared A*–G: ISC GCSE results 2005 — Eton CollegeSource and calculation
How it adds up

From 805 entries.

Lettered GCSE: A* 538 · A 239 · B 28

A*–G: subject results, 2005
2004 100.0% 856 entries SPGS printed 100.0%, the same figure. Compared A*–G: ISC GCSE results 2004 — St Paul’s Girls’ SchoolSource and calculation
How it adds up

856 of 856 lettered GCSE entries at A*–C.

Lettered GCSE: A* 654 · A 168 · B 30 · C 4

A*–G: subject results, 2004
2003 99.5–100.0% 886 entries A range A*–G: SPGS GCE and GCSE June2003 analysis: GCSE Level 6thSource and calculation
How it adds up

From 886 entries.

A*–G: subject results, 2003
2002 99.9% 816 entries SPGS printed 99.9%, the same figure. Compared A*–G: ISC GCSE results 2002 — St Paul’s Girls’ SchoolSource and calculation
How it adds up

815 of 816 lettered GCSE entries at A*–C.

Lettered GCSE: A* 599 · A 167 · B 40 · C 9 · D 1

A*–G: subject results, 2002
2001 100.0% 861 entries SPGS printed 100.0%, the same figure. Compared A*–G: ISC GCSE results 2001 — St Paul’s Girls’ SchoolSource and calculation
How it adds up

861 of 861 lettered GCSE entries at A*–C.

Lettered GCSE: A* 648 · A 184 · B 28 · C 1

A*–G: subject results, 2001
2000 A*–C figure not recovered
No figure We have found SPGS’s 2000 GCSE results, but not as percentages covering all subject entries. The result cannot be included in this comparison.
1999 A*–C figure not recovered
No figure We haven’t searched for SPGS’s 1999 GCSE results yet.
1998 A*–C figure not recovered No figure SPGS’s 1998 lettered GCSE table doesn’t give A*–C on its own. A*–G: The Times GCSE results, 5 Sep 1998Record and source
1997 A*–C figure not recovered No figure SPGS’s 1997 lettered GCSE table doesn’t give A*–C on its own. Record and source
1996 100% Not printed SPGS printed 100%, the same figure. Compared A*–G: St Paul’s Girls’ School: GCSE results 1996Source and calculation
1995 99.9% Not printed SPGS printed 99.85% at A*–C. Compared A*–G: St Paul’s Girls’ School: GCSE results 1995Source and calculation
1994 A*–C figure not recovered No figure SPGS’s 1994 lettered GCSE table doesn’t give A*–C on its own. A*–G: The Times GCSE results, 3 Sep 1994Record and source

Every year GCSE · Grade 9

The 10 years covered here, newest first. Missing figures are explained alongside the results we have found. Grade 9, as a share of entries graded 9–1 only. Lettered GCSE entries are excluded.

St Paul’s Girls’ School: GCSE · Grade 9, 2025 and 2026
YearGrade 9Entries graded 9–1SPGS’s own figureStatusNoteSources
2026 · This summer · 2026 results, as each school publishes them.
2026 Grade 9 figure not recovered
No figure SPGS’s 2026 numbered GCSE table doesn’t give 9 on its own. We don’t have SPGS’s whole-school lettered GCSE figure for 2026. Record and source
2023–25 · Grading as before · Grading returns to its pre-pandemic standard.
2025 84.7% 1,056 entries graded 9–1 SPGS printed 84.7%, the same figure. Compared 9–1: SPGS 2025 provisional GCSE/IGCSE results: numbered gradesSource and recorded figure
How it adds up

894 of 1,056 numbered GCSE entries at 9.

Numbered GCSE: 9 894 · 8 136 · 7 22 · 6 2 · 5 2 · 4 0

9–1: subject results, 2025
GCSE · Grade 9: 8 more years, 2017 to 2024
St Paul’s Girls’ School: GCSE · Grade 9, 2017 to 2024
YearGrade 9Entries graded 9–1SPGS’s own figureStatusNoteSources
2023–25 · Grading as before · Grading returns to its pre-pandemic standard.
2024 83.6% 1,079 entries graded 9–1 SPGS printed 83.6%, the same figure. Compared 9–1: SPGS 2024 provisional GCSE/IGCSE results: numbered gradesSource and recorded figure
How it adds up

902 of 1,079 numbered GCSE entries at 9.

Numbered GCSE: 9 902 · 8 121 · 7 39 · 6 14 · 5 2 · 4 1

9–1: subject results, 2024
2023 81.9% 1,004 entries graded 9–1 SPGS printed 81.9%, the same figure. Compared 9–1: St Paul’s Girls’ School: GCSE/IGCSE results 2023Source and recorded figure
How it adds up

822 of 1,004 numbered GCSE entries at 9.

Numbered GCSE: 9 822 · 8 132 · 7 40 · 6 5 · 5 4 · 4 0

9–1: subject results, 2023
2022 · The way back · Exams return, graded between the 2019 and 2021 standards.
2022 85.8% 1,007 entries graded 9–1 SPGS printed 85.8%, the same figure. Compared Grades in 2022 were set at a midpoint between summer 2019 and 2021, on Ofqual’s account. Ofqual 9–1: SPGS 2022 GCSE/IGCSE results: numbered gradesSource and recorded figure
How it adds up

864 of 1,007 numbered GCSE entries at 9.

Numbered GCSE: 9 864 · 8 93 · 7 34 · 6 12 · 5 3 · 4 1

9–1: subject results, 2022
2020–21 · No exams · Exams were cancelled. Teachers set the grades.
2021 89% 1,030 entries graded 9–1 SPGS printed 89%, the same figure. Set by teachers Grades were set by teachers in 2021, not by exams. We show the figure but don’t compare it. 9–1: SPGS 2021 provisional GCSE/IGCSE results: numbered gradesSource and recorded figure
How it adds up

917 of 1,030 numbered GCSE entries at 9.

Numbered GCSE: 9 917 · 8 86 · 7 25 · 6 2 · 5 0 · 4 0

2020 86% 977 entries graded 9–1 SPGS printed 86%, the same figure. Set by teachers Grades were set by teachers in 2020, not by exams. We show the figure but don’t compare it. 9–1: SPGS 2020 GCSE/IGCSE provisional results: numbered gradesSource and recorded figure
How it adds up

840 of 977 numbered GCSE entries at 9.

Numbered GCSE: 9 840 · 8 119 · 7 18 · 6 0 · 5 0 · 4 0

2017–19 · Numbers arrive · GCSEs move to grades 9 to 1, English and maths first, in 2017.
2019 numbered GCSE 85% at 9Results for individual qualifications; no combined annual figure
Published by qualification: 85% at 9 (numbered GCSE). No whole-year figure is established. Qualification only We haven’t confirmed which qualifications pupils took, so we cannot combine their results. 9–1: SPGS2019 GCSE/IGCSE examination results: grades9–1Record and source
2018 83.4% 235 entries graded 9–1 SPGS printed 83.4%, the same figure. Compared 9–1: SPGS 2018 GCSE and IGCSE results: numbered gradesSource and recorded figure
How it adds up

196 of 235 numbered GCSE entries at 9.

Numbered GCSE: 9 196 · 8 32 · 7 7 · 6 0 · 5 0 · 4 0

9–1: subject results, 2018
2017 Grade 9 figure not recovered
No figure No entries were graded 9–1 this year, so there is no grade-9 figure. Record and source
Before you compare

Some school accounts discuss offers and destinations together. We compare a figure only when it is clear which it counts.

Start with the same qualification, grade band and years for both schools. That gives you a fairer reading of their results. Whether your child would enjoy and thrive in either school needs a wider conversation.

Where leavers went

Offers aren’t places: one pupil can hold several offers but take up one place.

Latest Oxford and Cambridge figures: 2025 admissions round. Latest list of where leavers went: 2026 leavers. Last checked 15 Oct 2026

2026 · Where leavers went

University destinations

>50 · destinations

Source: School news article, 13 Aug 2026

What these figures count

Students moving on to Oxford or Cambridge in 2026

What it counts: Students moving on to Oxford or Cambridge in 2026

Where it’s from: Dated school article, 2026-08-13

Worth knowing: Strictly more than 50; grouped institutions remain unallocated. No application or offer denominator.

How the source defines it: Students moving on to Oxford or Cambridge in 2026

The full record also shows the original wording.

Source and full figures: University destinations, 2026

2026 · Where leavers went

University destinations

22 · destinations

Source: School news article, 13 Aug 2026

What these figures count

2026 leavers continuing to US universities

What it counts: 2026 leavers continuing to US universities

Where it’s from: Dated school article, 2026-08-13

Worth knowing: One grouped pupil count, not the sum of all mentioned universities.

How the source defines it: 2026 leavers continuing to US universities

The full record also shows the original wording.

Source and full figures: University destinations, 2026

How pupils join

Entry points to ask about: 11+ (Year 7) · 16+ (Year 12)

For these entry notes, we consulted Transfer Information & Updates 2026–27 (2026–27 feeder guide). Check the school’s current dates and requirements before making plans.

Current admissions information on SPGS’s site Checked 23 Sep 2026

Read the entry notes at St Paul’s Girls’ School

Questions to take to the school

  • Which 2026 A-level figure for A*, A*–A and A*–B is final? We’ve seen more than one.
  • How many GCSE/IGCSE entries does your 2026 grades 9–8 figure count? The publication we have doesn’t print the total.
  • What are this year’s entry points, dates and assessments?

Print these with the latest figures

Which years can I compare?

1,588 records from 1990 to 2026: results for A level, GCSE/IGCSE and Other qualifications (5 qualifications in all), and 410 university records. Taking the school’s figures as published, the longest run on one unchanged definition is A-level grades at A*, 2010–2025 (10 years). The record above counts its years on our combined annual figure, which joins qualifications and grading systems by a stated rule.

How many years each measure has, with a reason where a comparison is unavailable.

Years in each measure’s span. Columns overlap, so don’t add them up.
Measure and yearsYears with figuresYears in chartsPublications differ2020–21 (teacher-assessed)Ranges such as “over 90%”Years with no record at all
A-level grades at A* 2010–202615102200
GCSE / IGCSE entries at grade 9 2023–2024220000
Legacy GCSE / IGCSE entries at A* 2013110000

The last column counts years in the span with no record at all, not zero results. A year can have figures and still not be comparable; those are counted in the columns to its left.

What we’ve searched

Across the years and categories below, we have a figure for 135 of 200 entries, searched without finding one for 46, haven’t searched 17 yet, and 2 didn’t apply. The notes mark any years where we finished searching without finding a figure. A year without a figure isn’t a zero, and isn’t evidence the school published nothing.

  • Figure found — We have a figure for this year, with the document it came from.
  • Found, not compared — We have found a figure, but cannot establish exactly what it counts or whom it covers. It stays out of comparisons until that is clear.
  • No figure yet — We haven’t found a figure for this year. The notes below say where we looked and whether the search remains open. A missing figure does not mean the school published nothing.
  • Not researched yet — We haven’t searched for this year yet, so a blank here tells you nothing about what the school published.
  • Did not apply — This qualification or outcome didn’t exist, or wasn’t offered here, in this year, and we have a source that says so.

A-level

Covers A-level grades, including the A* measures charted above. We have a figure for 22 of the 37 years from 1990 to 2026. Of the rest, we searched 12 without finding a figure yet and haven’t searched 3 yet. Figure found: 2003 and 2006–2026. No figure yet: 1992–1994, 1996–2002 and 2004–2005. Not researched yet: 1990–1991 and 1995.

Where we looked for the 12 missing years
1992
Original 1992 government workbook exact school-identifier lookup

Where: 1991-1992/england_ks5.xlsx, 1992- Institution. What it said: Exact school identifier row found and supported pupil-threshold/A-AS observations integrated with original definitions. (read 6 Sep 2026)

1993
Original DfE ZIP, school identity, annual row and historical point/population definitions checked

Where: 1992-1993/england_ks5.xls, 1993- Institution, row 1752. What it said: 4 supported outcome fields recovered separately. Mixed qualifications, historic point scales, retrospective versions and pupil achievement thresholds do not supply pure qualification grade distributions. Remaining school original publication routes require separate investigation. (read 6 Sep 2026)

1994
Original DfE ZIP, school identity, annual row and historical point/population definitions checked

Where: 1993-1994/england_ks5.xlsx, 1994- Institution, row 45. What it said: 5 supported outcome fields recovered separately. Mixed qualifications, historic point scales, retrospective versions and pupil achievement thresholds do not supply pure qualification grade distributions. Remaining school original publication routes require separate investigation. (read 6 Sep 2026)

1996
Original DfE ZIP, school identity, annual row and historical point/population definitions checked

Where: 1995-1996/england_ks5.xls, 1996- Institution, row 38. What it said: 5 supported outcome fields recovered separately. Mixed qualifications, historic point scales, retrospective versions and pupil achievement thresholds do not supply pure qualification grade distributions. Remaining school original publication routes require separate investigation. (read 6 Sep 2026)

1997
Original DfE ZIP, school identity, annual row and historical point/population definitions checked

Where: 1996-1997/england_ks5.xlsx, 1997- Institution, row 38. What it said: 5 supported outcome fields recovered separately. Mixed qualifications, historic point scales, retrospective versions and pupil achievement thresholds do not supply pure qualification grade distributions. Remaining school original publication routes require separate investigation. (read 6 Sep 2026)

1998
Original DfE ZIP, school identity, annual row and historical point/population definitions checked

Where: 1997-1998/england_ks5.xlsx, 1998- Institution, row 45. What it said: 12 supported outcome fields recovered separately. Mixed qualifications, historic point scales, retrospective versions and pupil achievement thresholds do not supply pure qualification grade distributions. Remaining school original publication routes require separate investigation. (read 6 Sep 2026)

1999
Original DfE ZIP, school identity, annual row and historical point/population definitions checked

Where: 1998-1999/england_ks5.xlsx, 1999- Institution, row 47. What it said: 12 supported outcome fields recovered separately. Mixed qualifications, historic point scales, retrospective versions and pupil achievement thresholds do not supply pure qualification grade distributions. Remaining school original publication routes require separate investigation. (read 6 Sep 2026)

2000
Original DfE ZIP, school identity, annual row and historical point/population definitions checked

Where: 1999-2000/england_ks5.xls, 2000- Institution, row 34. What it said: 12 supported outcome fields recovered separately. Mixed qualifications, historic point scales, retrospective versions and pupil achievement thresholds do not supply pure qualification grade distributions. Remaining school original publication routes require separate investigation. (read 6 Sep 2026)

2001
Original DfE ZIP, school identity, annual row and historical point/population definitions checked

Where: 2000-2001/england_ks5.xls, 2001- Institution, row 372. What it said: 5 supported outcome fields recovered separately. Mixed qualifications, historic point scales, retrospective versions and pupil achievement thresholds do not supply pure qualification grade distributions. Remaining school original publication routes require separate investigation. (read 6 Sep 2026)

2002
Original DfE ZIP, school identity, annual row and historical point/population definitions checked

Where: 2001-2002/england_ks5.xls, 2002- Institution, row 369. What it said: 3 supported outcome fields recovered separately. Mixed qualifications, historic point scales, retrospective versions and pupil achievement thresholds do not supply pure qualification grade distributions. Remaining school original publication routes require separate investigation. (read 6 Sep 2026)

2004
HTTPS GET original public location

What it said: Retrieved original candidate; only separately reviewed fields count as verified evidence. (read 6 Sep 2026)

HTTPS GET original public location

What it said: HTTP 502; publication content not inspected. (read 6 Sep 2026)

Original DfE ZIP, school identity, annual row and historical point/population definitions checked

Where: 2003-2004/england_ks5.xls, 2004- Institution, row 1922. What it said: 3 supported outcome fields recovered separately. Mixed qualifications, historic point scales, retrospective versions and pupil achievement thresholds do not supply pure qualification grade distributions. Remaining school original publication routes require separate investigation. (read 6 Sep 2026)

2005
HTTPS GET original public location

What it said: Retrieved original candidate; only separately reviewed fields count as verified evidence. (read 6 Sep 2026)

HTTPS GET original public location

What it said: HTTP 502; publication content not inspected. (read 6 Sep 2026)

Original DfE ZIP, school identity, annual row and historical point/population definitions checked

Where: 2004-2005/england_ks5.xls, Institution, row 1899. What it said: 3 supported outcome fields recovered separately. Mixed qualifications, historic point scales, retrospective versions and pupil achievement thresholds do not supply pure qualification grade distributions. Remaining school original publication routes require separate investigation. (read 6 Sep 2026)

Not searched yet: 1990–1991 and 1995. A blank here says nothing about what the school published.

GCSE/IGCSE

Covers GCSE and IGCSE grades, numbered and lettered. We have a figure for 28 of the 35 years from 1992 to 2026. Of the rest, we haven’t searched 7 yet. Figure found: 1992 and 2000–2026. Not researched yet: 1993–1999.

Not searched yet: 1993–1999. A blank here says nothing about what the school published.

Pre-U

Covers Cambridge Pre-U grades, which are not charted as a separate series. We have a figure for 7 of the 10 years from 2017 to 2026. Of the rest, we searched 1 without finding a figure yet, and 2 didn’t apply. Figure found: 2017–2023. No figure yet: 2024. Did not apply: 2025–2026.

Where we looked for the 1 missing year
2024
HTTPS GET original public location

What it said: Retrieved original candidate; only separately reviewed fields count as verified evidence. (read 6 Sep 2026)

HTTPS GET original public location

What it said: HTTP 502; publication content not inspected. (read 6 Sep 2026)

Original government workbook metadata and exact institution rows inspected across underlying sheets

What it said: 0 subject observations recovered with original qualification and government cohort definitions. No matching row does not establish that a qualification was never offered or that a school publication does not exist. This completes this government-publication route only; school publications and other remaining year/category routes remain open. content.explore-education-statistics.service.gov.uk, read 6 Sep 2026

IB

Covers International Baccalaureate results, which are not charted as a separate series. We don’t have a figure for any of the 37 years from 1990 to 2026 yet. Of those, we searched 33 without finding a figure yet and haven’t searched 4 yet. No figure yet: 1993–1994 and 1996–2026. Not researched yet: 1990–1992 and 1995.

Where we looked for the 33 missing years
1993
Original DfE annual institution row: explicit IB entry/achievement columns checked

Where: 1992-1993/england_ks5.xls, 1993- Institution, row 1752. What it said: Original IB entry/achievement fields checked: Number of pupils entered for International Baccalaureate = blank; Percentage of pupils achieving International Baccalaureate = blank. Numeric observations preserved where published; blank never establishes zero or historical non-applicability. (read 6 Sep 2026)

1994
Original DfE annual institution row: explicit IB entry/achievement columns checked

Where: 1993-1994/england_ks5.xlsx, 1994- Institution, row 45. What it said: Original IB entry/achievement fields checked: number of pupils aged 16, 17, or 18 entered for the IB diploma = blank; % of pupils aged 16, 17, or 18 achieving the IB diploma = blank. Numeric observations preserved where published; blank never establishes zero or historical non-applicability. (read 6 Sep 2026)

1996
Original DfE annual institution row: explicit IB entry/achievement columns checked

Where: 1995-1996/england_ks5.xls, 1996- Institution, row 38. What it said: Original IB entry/achievement fields checked: number of students aged 16-18 entered for the IB Diploma = blank; % of those students aged 16-18 achieving the IB Diploma = blank. Numeric observations preserved where published; blank never establishes zero or historical non-applicability. (read 6 Sep 2026)

1997
Original DfE annual institution row: explicit IB entry/achievement columns checked

Where: 1996-1997/england_ks5.xlsx, 1997- Institution, row 38. What it said: Original IB entry/achievement fields checked: number of students aged 16-18 entered for the IB Diploma = blank; % of those students aged 16-18 achieving the IB Diploma = blank. Numeric observations preserved where published; blank never establishes zero or historical non-applicability. (read 6 Sep 2026)

1998
Original DfE annual institution row: explicit IB entry/achievement columns checked

Where: 1997-1998/england_ks5.xlsx, 1998- Institution, row 45. What it said: Original IB entry/achievement fields checked: number of students aged 16-18 entered for the IB diploma = blank; % of students aged 16-18 achieving the IB diploma = blank. Numeric observations preserved where published; blank never establishes zero or historical non-applicability. (read 6 Sep 2026)

1999
Original DfE annual institution row: explicit IB entry/achievement columns checked

Where: 1998-1999/england_ks5.xlsx, 1999- Institution, row 47. What it said: Original IB entry/achievement fields checked: number of students aged 16-18 entered for the IB diploma = blank; % of students aged 16-18 achieving the IB diploma = blank. Numeric observations preserved where published; blank never establishes zero or historical non-applicability. (read 6 Sep 2026)

2000
Original DfE annual institution row: explicit IB entry/achievement columns checked

Where: 1999-2000/england_ks5.xls, 2000- Institution, row 34. What it said: Original IB entry/achievement fields checked: number of students aged 16-18 entered for the IB diploma = blank; % of students aged 16-18 achieving the IB diploma = blank. Numeric observations preserved where published; blank never establishes zero or historical non-applicability. (read 6 Sep 2026)

2001
Original DfE annual institution row: explicit IB entry/achievement columns checked

Where: 2000-2001/england_ks5.xls, 2001- Institution, row 372. What it said: Original IB entry/achievement fields checked: number of students aged 16-18 entered for the IB diploma = blank; % of students aged 16-18 achieving the IB diploma = blank. Numeric observations preserved where published; blank never establishes zero or historical non-applicability. (read 6 Sep 2026)

2002
Original DfE annual institution row: explicit IB entry/achievement columns checked

Where: 2001-2002/england_ks5.xls, 2002- Institution, row 369. What it said: Original IB entry/achievement fields checked: number of students aged 16-18 entered for the IB diploma = blank; % of students aged 16-18 achieving the IB diploma = blank. Numeric observations preserved where published; blank never establishes zero or historical non-applicability. (read 6 Sep 2026)

2003Search finished; no figure found
Dated school/year discovery query

What it said: No supporting annual IB results or school-specific IB authorisation history located for the queried London school/year in returned sources. Search results included different institutions in Brazil, Australia and Asia and unrelated IB totals; these were not assigned to either London school. (read 6 Sep 2026)

School-specific original curriculum/history/inspection, available archive and IB directory review

What it said: The documented routes did not establish historical IB applicability or a value for this year. A-level/Pre-U evidence is not proof of historical IB absence. (read 6 Sep 2026)

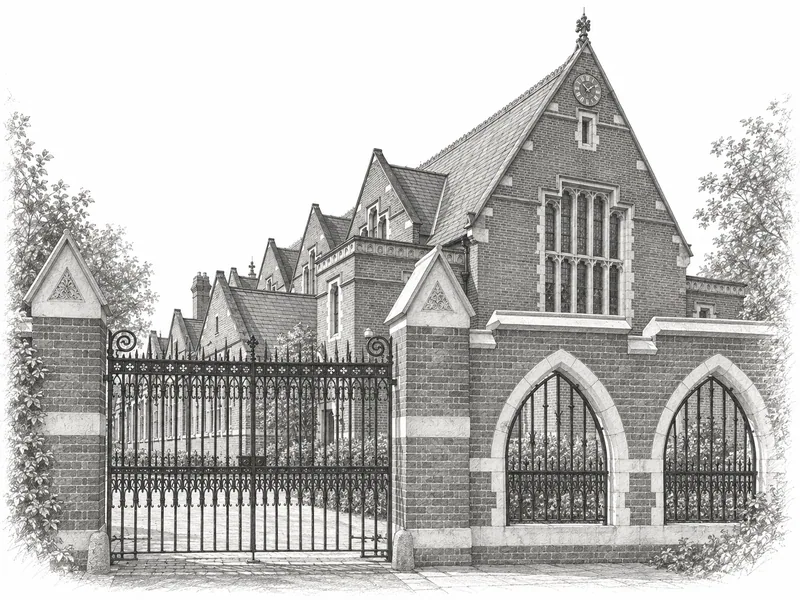
Original DfE annual institution row: explicit IB entry/achievement columns checked

Where: 2002-2003/england_ks5.xls, 2003- Institution, row 374. What it said: Original IB entry/achievement fields checked: number of students aged 16-18 entered for the IB diploma = blank; % of students aged 16-18 achieving the IB diploma = blank. Numeric observations preserved where published; blank never establishes zero or historical non-applicability. (read 6 Sep 2026)

2004Search finished; no figure found
HTTPS GET original public location

What it said: Retrieved original candidate; only separately reviewed fields count as verified evidence. (read 6 Sep 2026)

Dated school/year discovery query

What it said: No supporting annual IB results or school-specific IB authorisation history located for the queried London school/year in returned sources. Search results included different institutions in Brazil, Australia and Asia and unrelated IB totals; these were not assigned to either London school. (read 6 Sep 2026)

School-specific original curriculum/history/inspection, available archive and IB directory review

What it said: The documented routes did not establish historical IB applicability or a value for this year. A-level/Pre-U evidence is not proof of historical IB absence. (read 6 Sep 2026)

2005Search finished; no figure found
HTTPS GET original public location

What it said: Retrieved original candidate; only separately reviewed fields count as verified evidence. (read 6 Sep 2026)

HTTPS GET original public location

What it said: HTTP 502; publication content not inspected. (read 6 Sep 2026)

Dated school/year discovery query

What it said: No supporting annual IB results or school-specific IB authorisation history located for the queried London school/year in returned sources. Search results included different institutions in Brazil, Australia and Asia and unrelated IB totals; these were not assigned to either London school. (read 6 Sep 2026)

2006Search finished; no figure found
Dated school/year discovery query

What it said: No supporting annual IB results or school-specific IB authorisation history located for the queried London school/year in returned sources. Search results included different institutions in Brazil, Australia and Asia and unrelated IB totals; these were not assigned to either London school. (read 6 Sep 2026)

School-specific original curriculum/history/inspection, available archive and IB directory review

What it said: The documented routes did not establish historical IB applicability or a value for this year. A-level/Pre-U evidence is not proof of historical IB absence. (read 6 Sep 2026)

2007Search finished; no figure found
Original ISC annual worksheet row/name/reference and qualification-definition check

Where: uvwAlevelTotalOutput. What it said: School row located; nonzero applicable qualification fields transcribed with original scope. (read 6 Sep 2026)

Dated school/year discovery query

What it said: No supporting annual IB results or school-specific IB authorisation history located for the queried London school/year in returned sources. Search results included different institutions in Brazil, Australia and Asia and unrelated IB totals; these were not assigned to either London school. (read 6 Sep 2026)

School-specific original curriculum/history/inspection, available archive and IB directory review

What it said: The documented routes did not establish historical IB applicability or a value for this year. A-level/Pre-U evidence is not proof of historical IB absence. (read 6 Sep 2026)

2008Search finished; no figure found
HTTPS GET original public location

What it said: Retrieved original candidate; only separately reviewed fields count as verified evidence. (read 6 Sep 2026)

Original ISC annual worksheet row/name/reference and qualification-definition check

Where: A-Level Results 2008 Total. What it said: School row located; nonzero applicable qualification fields transcribed with original scope. (read 6 Sep 2026)

Dated school/year discovery query

What it said: No supporting annual IB results or school-specific IB authorisation history located for the queried London school/year in returned sources. Search results included different institutions in Brazil, Australia and Asia and unrelated IB totals; these were not assigned to either London school. (read 6 Sep 2026)

2009Search finished; no figure found
HTTPS GET original public location

What it said: Retrieved original candidate; only separately reviewed fields count as verified evidence. (read 6 Sep 2026)

HTTPS GET original public location

What it said: HTTP 502; publication content not inspected. (read 6 Sep 2026)

Original ISC annual worksheet row/name/reference and qualification-definition check

Where: A-Level Results 2009 Total. What it said: School row located; nonzero applicable qualification fields transcribed with original scope. (read 6 Sep 2026)

2010Search finished; no figure found
Original ISC annual worksheet row/name/reference and qualification-definition check

Where: IB Total. What it said: No row with this school’s stable ISC reference found in the checked original worksheet; this single survey route does not establish non-publication or qualification non-applicability. (read 6 Sep 2026)

Dated school/year discovery query

What it said: No supporting annual IB results or school-specific IB authorisation history located for the queried London school/year in returned sources. Search results included different institutions in Brazil, Australia and Asia and unrelated IB totals; these were not assigned to either London school. (read 6 Sep 2026)

School-specific original curriculum/history/inspection, available archive and IB directory review

What it said: The documented routes did not establish historical IB applicability or a value for this year. A-level/Pre-U evidence is not proof of historical IB absence. (read 6 Sep 2026)

2011Search finished; no figure found
HTTPS GET original public location

What it said: Retrieved original candidate; only separately reviewed fields count as verified evidence. (read 6 Sep 2026)

Original ISC annual worksheet row/name/reference and qualification-definition check

Where: IB TOTALS. What it said: No row with this school’s stable ISC reference found in the checked original worksheet; this single survey route does not establish non-publication or qualification non-applicability. (read 6 Sep 2026)

Dated school/year discovery query

What it said: No supporting annual IB results or school-specific IB authorisation history located for the queried London school/year in returned sources. Search results included different institutions in Brazil, Australia and Asia and unrelated IB totals; these were not assigned to either London school. (read 6 Sep 2026)

2012Search finished; no figure found
HTTPS GET original public location

What it said: Retrieved original candidate; only separately reviewed fields count as verified evidence. (read 6 Sep 2026)

HTTPS GET original public location

What it said: HTTP 502; publication content not inspected. (read 6 Sep 2026)

Original ISC annual worksheet row/name/reference and qualification-definition check

Where: TOTALS. What it said: No row with this school’s stable ISC reference found in the checked original worksheet; this single survey route does not establish non-publication or qualification non-applicability. (read 6 Sep 2026)

2013Search finished; no figure found
Original ISC annual worksheet row/name/reference and qualification-definition check

Where: TOTAL. What it said: No row with this school’s stable ISC reference found in the checked original worksheet; this single survey route does not establish non-publication or qualification non-applicability. (read 6 Sep 2026)

Dated school/year discovery query

What it said: No supporting annual IB results or school-specific IB authorisation history located for the queried London school/year in returned sources. Search results included different institutions in Brazil, Australia and Asia and unrelated IB totals; these were not assigned to either London school. (read 6 Sep 2026)

School-specific original curriculum/history/inspection, available archive and IB directory review

What it said: The documented routes did not establish historical IB applicability or a value for this year. A-level/Pre-U evidence is not proof of historical IB absence. (read 6 Sep 2026)

2014Search finished; no figure found
HTTPS GET original public location

What it said: Retrieved original candidate; only separately reviewed fields count as verified evidence. (read 6 Sep 2026)

HTTPS GET original public location

What it said: HTTP 502; publication content not inspected. (read 6 Sep 2026)

Original ISC annual worksheet row/name/reference and qualification-definition check

Where: TOTAL. What it said: No row with this school’s stable ISC reference found in the checked original worksheet; this single survey route does not establish non-publication or qualification non-applicability. (read 6 Sep 2026)

2015Search finished; no figure found
Original ISC annual worksheet row/name/reference and qualification-definition check

Where: TOTAL. What it said: No row with this school’s stable ISC reference found in the checked original worksheet; this single survey route does not establish non-publication or qualification non-applicability. (read 6 Sep 2026)

Dated school/year discovery query

What it said: No supporting annual IB results or school-specific IB authorisation history located for the queried London school/year in returned sources. Search results included different institutions in Brazil, Australia and Asia and unrelated IB totals; these were not assigned to either London school. (read 6 Sep 2026)

School-specific original curriculum/history/inspection, available archive and IB directory review

What it said: The documented routes did not establish historical IB applicability or a value for this year. A-level/Pre-U evidence is not proof of historical IB absence. (read 6 Sep 2026)

2016–2017Search finished; no figure found
HTTPS GET original public location

What it said: Retrieved original candidate; only separately reviewed fields count as verified evidence. (read 6 Sep 2026)

Original ISC annual worksheet row/name/reference and qualification-definition check

Where: BOYS AND GIRLS. What it said: No row with this school’s stable ISC reference found in the checked original worksheet; this single survey route does not establish non-publication or qualification non-applicability. (read 6 Sep 2026)

Dated school/year discovery query

What it said: No supporting annual IB results or school-specific IB authorisation history located for the queried London school/year in returned sources. Search results included different institutions in Brazil, Australia and Asia and unrelated IB totals; these were not assigned to either London school. (read 6 Sep 2026)

2018–2020Search finished; no figure found
HTTPS GET original public location

What it said: Retrieved original candidate; only separately reviewed fields count as verified evidence. (read 6 Sep 2026)

Dated school/year discovery query

What it said: No supporting annual IB results or school-specific IB authorisation history located for the queried London school/year in returned sources. Search results included different institutions in Brazil, Australia and Asia and unrelated IB totals; these were not assigned to either London school. (read 6 Sep 2026)

School-specific original curriculum/history/inspection, available archive and IB directory review

What it said: The documented routes did not establish historical IB applicability or a value for this year. A-level/Pre-U evidence is not proof of historical IB absence. (read 6 Sep 2026)

2021Search finished; no figure found
Dated school/year discovery query

What it said: No supporting annual IB results or school-specific IB authorisation history located for the queried London school/year in returned sources. Search results included different institutions in Brazil, Australia and Asia and unrelated IB totals; these were not assigned to either London school. (read 6 Sep 2026)

School-specific original curriculum/history/inspection, available archive and IB directory review

What it said: The documented routes did not establish historical IB applicability or a value for this year. A-level/Pre-U evidence is not proof of historical IB absence. (read 6 Sep 2026)

2022Search finished; no figure found
Dated school/year discovery query

What it said: No supporting annual IB results or school-specific IB authorisation history located for the queried London school/year in returned sources. Search results included different institutions in Brazil, Australia and Asia and unrelated IB totals; these were not assigned to either London school. (read 6 Sep 2026)

School-specific original curriculum/history/inspection, available archive and IB directory review

What it said: The documented routes did not establish historical IB applicability or a value for this year. A-level/Pre-U evidence is not proof of historical IB absence. (read 6 Sep 2026)

Original government workbook metadata and exact institution rows inspected across underlying sheets

What it said: 0 subject observations recovered with original qualification and government cohort definitions. No matching row does not establish that a qualification was never offered or that a school publication does not exist. This completes this government-publication route only; school publications and other remaining year/category routes remain open. content.explore-education-statistics.service.gov.uk, read 6 Sep 2026

2023Search finished; no figure found
HTTPS GET original public location

What it said: Retrieved original candidate; only separately reviewed fields count as verified evidence. (read 6 Sep 2026)

Dated school/year discovery query

What it said: No supporting annual IB results or school-specific IB authorisation history located for the queried London school/year in returned sources. Search results included different institutions in Brazil, Australia and Asia and unrelated IB totals; these were not assigned to either London school. (read 6 Sep 2026)

School-specific original curriculum/history/inspection, available archive and IB directory review

What it said: The documented routes did not establish historical IB applicability or a value for this year. A-level/Pre-U evidence is not proof of historical IB absence. (read 6 Sep 2026)

2024Search finished; no figure found
HTTPS GET original public location

What it said: Retrieved original candidate; only separately reviewed fields count as verified evidence. (read 6 Sep 2026)

HTTPS GET original public location

What it said: HTTP 502; publication content not inspected. (read 6 Sep 2026)

Dated school/year discovery query

What it said: No supporting annual IB results or school-specific IB authorisation history located for the queried London school/year in returned sources. Search results included different institutions in Brazil, Australia and Asia and unrelated IB totals; these were not assigned to either London school. (read 6 Sep 2026)

2025Search finished; no figure found
HTTPS GET original public location

What it said: Retrieved original candidate; only separately reviewed fields count as verified evidence. (read 6 Sep 2026)

HTTPS GET original public location

What it said: ReadTimeout: HTTPSConnectionPool(host='web.archive.org', port=443): Read timed out. (read timeout=12). (read 6 Sep 2026)

Dated school/year discovery query

What it said: No supporting annual IB results or school-specific IB authorisation history located for the queried London school/year in returned sources. Search results included different institutions in Brazil, Australia and Asia and unrelated IB totals; these were not assigned to either London school. (read 6 Sep 2026)

2026Search finished; no figure found
Original ISC annual worksheet row/name/reference and qualification-definition check

Where: BOYS AND GIRLS. What it said: No row with this school’s stable ISC reference found in the checked original worksheet; this single survey route does not establish non-publication or qualification non-applicability. (read 6 Sep 2026)

Dated school/year discovery query

What it said: No supporting annual IB results or school-specific IB authorisation history located for the queried London school/year in returned sources. Search results included different institutions in Brazil, Australia and Asia and unrelated IB totals; these were not assigned to either London school. (read 6 Sep 2026)

School-specific original curriculum/history/inspection, available archive and IB directory review

What it said: The documented routes did not establish historical IB applicability or a value for this year. A-level/Pre-U evidence is not proof of historical IB absence. (read 6 Sep 2026)

Not searched yet: 1990–1992 and 1995. A blank here says nothing about what the school published.

university applications

Covers applications made, which are not offers or places, and are not charted as a series. We have a figure for 20 of the 21 years from 2006 to 2026. Of the rest, we haven’t searched 1 yet. Figure found: 2006–2025. Not researched yet: 2026.

Not searched yet: 2026. A blank here says nothing about what the school published.

university offers

Covers offers received, which are not places taken up, and are not charted as a series. We have a figure for 20 of the 21 years from 2006 to 2026. Of the rest, we haven’t searched 1 yet. Figure found: 2006–2025. Not researched yet: 2026.

Not searched yet: 2026. A blank here says nothing about what the school published.

university acceptances

Covers places accepted, which are not confirmed destinations; no chart plots them. We have a figure for 20 of the 21 years from 2006 to 2026. Of the rest, we haven’t searched 1 yet. Figure found: 2006–2025. Not researched yet: 2026.

Not searched yet: 2026. A blank here says nothing about what the school published.

university destinations

Covers where leavers actually went, read on the destinations page rather than as a chart. We have a figure for 18 of the 18 years from 2009 to 2026. Figure found: 2009–2026.

Where these figures come from

We last checked one of SPGS’s figures against its original on 15 Oct 2026. Each figure’s record page says which document it came from and when we checked it. Check a figure from SPGS

95 checked results documents, 1990–2026

Compare SPGS with Latymer Upper5 shared years on A-level grades at A*, 2018–2025

Architectural illustration of Latymer Upper School
Generated illustration · credits
AI-generated architectural illustration with translucent colour wash made from photographic references; not a photograph, a commission or a measured survey. · Photograph reference (Chiswick Chap) · CC BY-SA 4.0

Figure and sourceOpen full record ↗