School record · Dulwich, London

Dulwich College

1,499 evidence entries from 1992 to 2026: results for A level, GCSE / IGCSE and AS-level, among 12 qualifications; 188 university entries. No results measure yet has two years comparable on one definition.

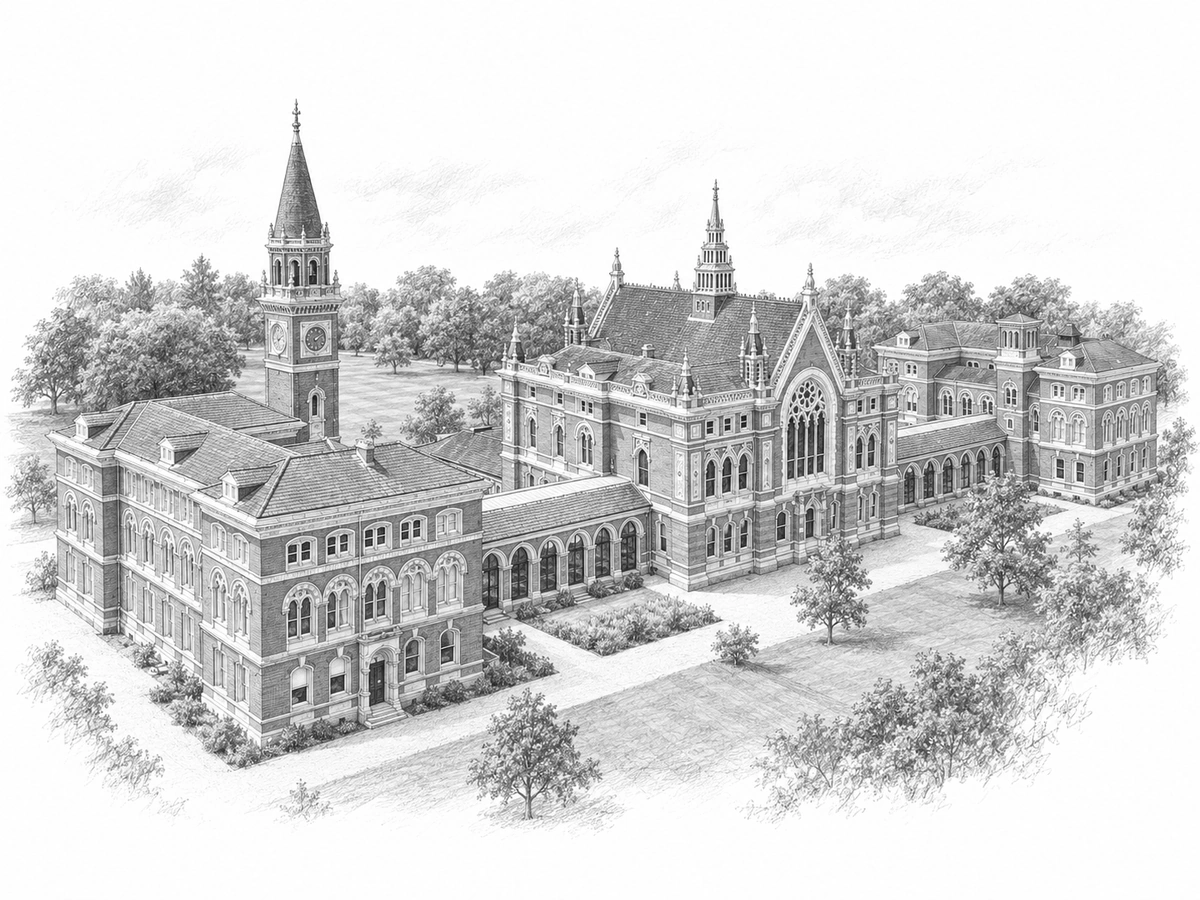
Graphite architectural illustration of Barry Buildings, elevated three-quarter view
AI illustration · credits
AI-generated architectural illustration: Barry Buildings, elevated three-quarter view. Not a photograph or school endorsement. The Schools Record (AI-generated illustration), architecture reference: Dulwich College. Generated illustration; reference rights retained by source owner · Image source Generated graphite interpretation; incidental people, vehicles and clutter removed; foliage simplified. Architectural details are illustrative, not a measured survey.
Compare results

Latest recorded results

The newest figures we hold for each qualification. A school may have published further results or revisions.

A level

2026 results

67.6%of A-level grades were A*–A

89.4%of A-level grades were A*–B

238A* grades recorded

Definitions and publication notes

What is counted: A-level subject entries

Subject entries counted: 792

Publication note: Pre-review results

Research note: Prior to reviews of marking. 792 is subject entries, not pupils. A-star share is not separately printed in the total row; no calculated share substituted.

Definition in the record: A-level subject entries. Published counts and percentage bands.

Read the source and full result

GCSE / IGCSE

2026 results

55.4%of GCSE / IGCSE grades were grade 9

82.1%of GCSE / IGCSE grades were grades 9–8

Definitions and publication notes

What is counted: Numbered grade entries

Subject entries counted: 2319

Publication note: Pre-review results

Research note: Pre-review. Double-award science has a distinct entries/grades basis; use school-printed totals, do not silently recalculate from subject rows.

Definition in the record: Year 11 I/GCSE published totals.

Read the source and full result

Sixth-form results (qualification scope unresolved)

2025 results

32%A*

69%A*–A

89%A*–B

Definitions and publication notes

Publication note: Primary

Research note: Source labels these A Level. Pure A-level versus historical Pre-U inclusion has not yet been established against qualification-specific original tables. Values remain retrieval evidence, excluded from pure A-level comparisons. Rounded annual-report percentages are not substituted for more precise original results.

Definition in the record: 2025 Governors report PDF page6; 2025 column, rows labelled A Level.

Read the source and full result

A2 (qualification scope unresolved)

2016 results

26%A*

63%A*–A

90%A*–B

Definitions and publication notes

Publication note: Primary

Research note: Published percentage of subject entries, not pupils. No pupil denominator inferred. Repeated annual tables are retained as source versions, not independent cohorts. The printed label is A2; inclusion or exclusion of Pre-U is not established. No A-level-only comparison eligibility.

Definition in the record: 2016 governors report, PDF page 9 (printed 7), 2016 column and named grade-band rows.

Read the source and full result

Newest results in our record: A level 2026 · GCSE / IGCSE 2026 · Sixth-form results (qualification scope unresolved) 2025 · A2 (qualification scope unresolved) 2016.

Browse all results tablesExplore change over time ↓

Before comparing this school

Historical coverage is still being researched. A checked result for one year does not mean that every year is covered.

Use the same qualification, grade band and years for each school. Exam grades describe a cohort’s results; they do not tell you which school will suit an individual child.

Check the underlying results and sources

How have results changed?

What this school’s own published figures show, measure by measure, comparing only the years published on a single definition and naming those years.

GCSE / IGCSE entries at grade 9 · 2026

One year of GCSE / IGCSE entries at grade 9 is held (2026, at 55.4%), so the record shows no change over time.

What this is comparing, and what it cannot say

One figure cannot establish a direction. A second year on the same definition is what would make this a trend.

The charts keep A-level, numbered GCSE grades and older GCSE grades apart, because a grade on one qualification is not a grade on another.

A-level grades at A*

There are no comparable figures to plot for this period. The coverage and source records explain which figures are missing or cannot be compared.

GCSE / IGCSE entries at grade 9
GCSE / IGCSE entries at grade 9 · 2026
Dulwich: 1 year. Each point links to its source record; the exact values are listed below the chart.Dulwich · 2026 · 55.4%

Each school is shown against the same scale and years.

Dulwich
Dulwich: 1 year. Each point links to its source record; the exact values are listed below the chart.Dulwich · 2026 · 55.4%

Select a point to check its source. A break in a line means a year has no comparable figure; nothing is interpolated and no result has been estimated. The figures behind the chart are listed below.

See the values and sources behind this chart
Exact supporting values · source precision retained
School / yearPublished valuePopulation and denominatorStatus and precisionEvidence
Dulwich College
2026
55.4%GCSE / IGCSE 9–1 · Grade awardsNumbered grade entriesDenominator: 2319Pre-review results0 decimal placesInspect evidence: Dulwich College, 2026, grade_9new:dulwich:2026:gcse-igcse:published
Legacy GCSE / IGCSE entries at A*

There are no comparable figures to plot for this period. The coverage and source records explain which figures are missing or cannot be compared.

For Pre-U, IB, mixed qualifications and figures that cannot be charted directly, browse the full exam results.

All qualifications held in our record

A level

611 records, with dated results from 1992 to 2026. There may be gaps within that period.

Read the results and definitions

GCSE / IGCSE

359 records, with dated results from 1992 to 2026. There may be gaps within that period.

Read the results and definitions

Sixth-form results (qualification scope unresolved)

48 records, with dated results from 2010 to 2025. There may be gaps within that period.

Read the results and definitions

A2 (qualification scope unresolved)

10 records, with dated results from 2011 to 2016. There may be gaps within that period.

Read the results and definitions

AS-level

211 records, with dated results from 2006 to 2025. There may be gaps within that period.

Read the results and definitions

AS-level including Applied

4 records, with dated results from 2010 to 2013. There may be gaps within that period.

Read the results and definitions

Sixth-form examination populations

9 records, with dated results from 2010 to 2026. There may be gaps within that period.

Read the results and definitions

Cambridge Pre-U

33 records, with dated results from 2011 to 2023. There may be gaps within that period.

Read the results and definitions

AS-level including Applied and International

4 records, with dated results from 2014 to 2026. There may be gaps within that period.

Read the results and definitions

FSMQ

7 records, with dated results from 2012 to 2016. There may be gaps within that period.

Read the results and definitions

Free-standing Mathematics Qualification (Level 3)

12 records, with dated results from 2017 to 2025. There may be gaps within that period.

Read the results and definitions

Other academic (qualification unresolved)

3 records, with dated results from 2021 to 2021. There may be gaps within that period.

Read the results and definitions

Where do pupils go next?

Explore published university figures. An offer is not the same as a place taken up, and one pupil may receive several offers.

Latest dated destination entry held: 2014 · 138 newer records (applications, offers, acceptances or admissions) are held in the full university records below. Coverage varies by year; a blank is not a zero.

2014 · Actual destinations

First or second choice university (not individually named)

destinations

80% · First or second choice · strictly greater than

What these figures count

More than 80% of boys reached their first or second choice university.

Publication note: Primary

Research note: Strict lower bound, not an exact 80% rate. The text says nearly all at Russell Group institutions, without a count or precise rate.

Definition in the record: More than 80% of boys reached their first or second choice university.

Read the source and full result

Which years can I compare?

A long date range can still contain gaps. This table shows how many years are available for each chart measure and where a comparison needs care.

Years within each measure’s recorded span; categories can overlap
Measure and yearsYears with figuresYears in chartsSources differ2020–2021Qualified figuresYears with no record at all
A-level grades at A* No chartable series yet — see the year-by-year record belowNot applicable: this measure has no recorded spanNot applicable: this measure has no recorded spanNot applicable: this measure has no recorded spanNot applicable: this measure has no recorded spanNot applicable: this measure has no recorded spanNot applicable: this measure has no recorded span
GCSE / IGCSE entries at grade 9 2026110000
Legacy GCSE / IGCSE entries at A* No chartable series yet — see the year-by-year record belowNot applicable: this measure has no recorded spanNot applicable: this measure has no recorded spanNot applicable: this measure has no recorded spanNot applicable: this measure has no recorded spanNot applicable: this measure has no recorded spanNot applicable: this measure has no recorded span

A dash means this measure has no chartable series yet, so none of these counts applies to it; the year-by-year record below still says what was searched for it. “Qualified figures” includes ranges and descriptions such as “over 90%”. The last column counts years inside the measure’s span for which we hold no record of any kind; they are not zero results. A year can hold records and still not be comparable — those are counted in the columns to its left, which is why this column is smaller than the number of years missing from a chart. The year-by-year record below names every year either way. Categories can overlap, so do not add the columns together.

Which years have been researched, and what was found

This is our record of our own work, not a statement about the school. 125 of the 296 school-year cells researched here hold a figure; 33 were searched without one being recovered; 117 have not been searched yet; 21 did not apply. No search for this school is yet recorded as closed: every year without a figure here remains open. A year without a figure is never a zero, and never evidence that the school published nothing.

Open the year-by-year record for all 8 categories
  • Figure held — We hold a recorded figure for this year, with the source it came from.
  • Found, not comparable — We found something for this year, but its definition, cohort or coverage is unresolved, so it cannot be compared with other years or schools.
  • No figure yet — We do not hold a figure for this year. The routes tried are listed; the year is still open, and this is not evidence that the school published nothing.
  • Not researched yet — Nobody has searched for this year yet, so its absence here tells you nothing about what the school published.
  • Did not apply — This qualification or outcome did not exist or was not offered here in this year, and we hold a source that says so.

A-level

Covers A-level grades, including the A* measures charted above. 35 of the 37 years from 1990 to 2026 hold a figure here and 2 have not been searched yet.

  1. 1990Not researched yet
  2. 1991Not researched yet
  3. 1992Figure held
  4. 1993Figure held
  5. 1994Figure held
  6. 1995Figure held
  7. 1996Figure held
  8. 1997Figure held
  9. 1998Figure held
  10. 1999Figure held
  11. 2000Figure held
  12. 2001Figure held
  13. 2002Figure held
  14. 2003Figure held
  15. 2004Figure held
  16. 2005Figure held
  17. 2006Figure held
  18. 2007Figure held
  19. 2008Figure held
  20. 2009Figure held
  21. 2010Figure held
  22. 2011Figure held
  23. 2012Figure held
  24. 2013Figure held
  25. 2014Figure held
  26. 2015Figure held
  27. 2016Figure held
  28. 2017Figure held
  29. 2018Figure held
  30. 2019Figure held
  31. 2020Figure held
  32. 2021Figure held
  33. 2022Figure held
  34. 2023Figure held
  35. 2024Figure held
  36. 2025Figure held
  37. 2026Figure held

Not searched yet: 1990–1991. Their absence here tells you nothing about what the school published.

GCSE/IGCSE

Covers GCSE and IGCSE grades, numbered and lettered. 29 of the 37 years from 1990 to 2026 hold a figure here and 8 have not been searched yet.

  1. 1990Not researched yet
  2. 1991Not researched yet
  3. 1992Figure held
  4. 1993Not researched yet
  5. 1994Not researched yet
  6. 1995Not researched yet
  7. 1996Not researched yet
  8. 1997Not researched yet
  9. 1998Not researched yet
  10. 1999Figure held
  11. 2000Figure held
  12. 2001Figure held
  13. 2002Figure held
  14. 2003Figure held
  15. 2004Figure held
  16. 2005Figure held
  17. 2006Found, not comparable
  18. 2007Figure held
  19. 2008Figure held
  20. 2009Figure held
  21. 2010Figure held
  22. 2011Figure held
  23. 2012Figure held
  24. 2013Figure held
  25. 2014Figure held
  26. 2015Figure held
  27. 2016Figure held
  28. 2017Figure held
  29. 2018Figure held
  30. 2019Figure held
  31. 2020Figure held
  32. 2021Figure held
  33. 2022Figure held
  34. 2023Figure held
  35. 2024Figure held
  36. 2025Figure held
  37. 2026Figure held

Not searched yet: 1990–1991 and 1993–1998. Their absence here tells you nothing about what the school published.

Pre-U

Covers Cambridge Pre-U grades, which are not charted as a separate series. 9 of the 37 years from 1990 to 2026 hold a figure here, 5 were searched without one being recovered, 2 have not been searched yet and 21 did not apply.

  1. 1990Did not apply
  2. 1991Did not apply
  3. 1992Did not apply
  4. 1993Did not apply
  5. 1994Did not apply
  6. 1995Did not apply
  7. 1996Did not apply
  8. 1997Did not apply
  9. 1998Did not apply
  10. 1999Did not apply
  11. 2000Did not apply
  12. 2001Did not apply
  13. 2002Did not apply
  14. 2003Did not apply
  15. 2004Did not apply
  16. 2005Did not apply
  17. 2006Did not apply
  18. 2007Did not apply
  19. 2008Did not apply
  20. 2009Not researched yet
  21. 2010No figure yet
  22. 2011Figure held
  23. 2012No figure yet
  24. 2013Figure held
  25. 2014Figure held
  26. 2015Figure held
  27. 2016Figure held
  28. 2017Figure held
  29. 2018No figure yet
  30. 2019Figure held
  31. 2020Not researched yet
  32. 2021No figure yet
  33. 2022Figure held
  34. 2023Figure held
  35. 2024No figure yet
  36. 2025Did not apply
  37. 2026Did not apply
What was tried for the 5 years with no figure
2010
  • Inspected named-school return availability in original ISC annual workbook
2012
  • Inspected named-school return availability in original ISC annual workbook
2018
  • Original recent government qualification tables checked with school identity, contemporary metadata, exact numeric cells and complete distribution parity; IB diploma points/component/core grades and source size groups kept separate
2021
  • Original recent government qualification tables checked with school identity, contemporary metadata, exact numeric cells and complete distribution parity; IB diploma points/component/core grades and source size groups kept separate
2024
  • Original recent government qualification tables checked with school identity, contemporary metadata, exact numeric cells and complete distribution parity; IB diploma points/component/core grades and source size groups kept separate

Not searched yet: 2009 and 2020. Their absence here tells you nothing about what the school published.

IB

Covers International Baccalaureate results, which are not charted as a separate series. None of the 37 years from 1990 to 2026 holds a figure here yet, 19 were searched without one being recovered and 18 have not been searched yet.

  1. 1990Not researched yet
  2. 1991Not researched yet
  3. 1992Not researched yet
  4. 1993Not researched yet
  5. 1994Not researched yet
  6. 1995Not researched yet
  7. 1996Not researched yet
  8. 1997Not researched yet
  9. 1998Not researched yet
  10. 1999Not researched yet
  11. 2000Not researched yet
  12. 2001Not researched yet
  13. 2002Not researched yet
  14. 2003Not researched yet
  15. 2004Not researched yet
  16. 2005Not researched yet
  17. 2006Not researched yet
  18. 2007No figure yet
  19. 2008No figure yet
  20. 2009No figure yet
  21. 2010No figure yet
  22. 2011No figure yet
  23. 2012No figure yet
  24. 2013No figure yet
  25. 2014No figure yet
  26. 2015No figure yet
  27. 2016No figure yet
  28. 2017No figure yet
  29. 2018No figure yet
  30. 2019No figure yet
  31. 2020Not researched yet
  32. 2021No figure yet
  33. 2022No figure yet
  34. 2023No figure yet
  35. 2024No figure yet
  36. 2025No figure yet
  37. 2026No figure yet
What was tried for the 19 years with no figure
2007–2016
  • Inspected named-school return availability in original ISC annual workbook
2017
  • Inspected named-school return availability in original ISC annual workbook
  • Original recent government qualification tables checked with school identity, contemporary metadata, exact numeric cells and complete distribution parity; IB diploma points/component/core grades and source size groups kept separate
  • Alleynian 2017 (public FlippingBook, 172 pages): complete text pass, 165 cached pages plus seven read through the reader; no usable annual London-college results table found. IB passages concern overseas Dulwich schools and do not establish London provision. Text-route finding only; other publications remain open.
2018–2019
  • Original recent government qualification tables checked with school identity, contemporary metadata, exact numeric cells and complete distribution parity; IB diploma points/component/core grades and source size groups kept separate
2021–2025
  • Original recent government qualification tables checked with school identity, contemporary metadata, exact numeric cells and complete distribution parity; IB diploma points/component/core grades and source size groups kept separate
2026
  • Inspected named-school return availability in original ISC annual workbook

Not searched yet: 1990–2006 and 2020. Their absence here tells you nothing about what the school published.

university applications

Covers applications made, which are not offers or places, and are not charted as a series. 17 of the 37 years from 1990 to 2026 hold a figure here, 3 were searched without one being recovered and 17 have not been searched yet.

  1. 1990Not researched yet
  2. 1991Not researched yet
  3. 1992Not researched yet
  4. 1993Not researched yet
  5. 1994Not researched yet
  6. 1995Not researched yet
  7. 1996Not researched yet
  8. 1997Not researched yet
  9. 1998Not researched yet
  10. 1999Not researched yet
  11. 2000Not researched yet
  12. 2001Not researched yet
  13. 2002Not researched yet
  14. 2003Not researched yet
  15. 2004Not researched yet
  16. 2005Not researched yet
  17. 2006No figure yet
  18. 2007No figure yet
  19. 2008No figure yet
  20. 2009Figure held
  21. 2010Figure held
  22. 2011Figure held
  23. 2012Figure held
  24. 2013Figure held
  25. 2014Figure held
  26. 2015Figure held
  27. 2016Figure held
  28. 2017Figure held
  29. 2018Figure held
  30. 2019Figure held
  31. 2020Figure held
  32. 2021Figure held
  33. 2022Figure held
  34. 2023Figure held
  35. 2024Figure held
  36. 2025Figure held
  37. 2026Not researched yet
What was tried for the 3 years with no figure
2006–2008
  • Oxford FOI 202405/468 original workbook: school/cycle row identified by UCAS school ID, name, postcode and group; applications, offers and acceptances tokens transcribed with the literal <3 suppression band retained. This is a university admissions-cycle count, not a leaver destination.

Not searched yet: 1990–2005 and 2026. Their absence here tells you nothing about what the school published.

university offers

Covers offers received, which are not places taken up, and are not charted as a series. 17 of the 37 years from 1990 to 2026 hold a figure here, 3 were searched without one being recovered and 17 have not been searched yet.

  1. 1990Not researched yet
  2. 1991Not researched yet
  3. 1992Not researched yet
  4. 1993Not researched yet
  5. 1994Not researched yet
  6. 1995Not researched yet
  7. 1996Not researched yet
  8. 1997Not researched yet
  9. 1998Not researched yet
  10. 1999Not researched yet
  11. 2000Not researched yet
  12. 2001Not researched yet
  13. 2002Not researched yet
  14. 2003Not researched yet
  15. 2004Not researched yet
  16. 2005Not researched yet
  17. 2006No figure yet
  18. 2007No figure yet
  19. 2008No figure yet
  20. 2009Figure held
  21. 2010Figure held
  22. 2011Figure held
  23. 2012Figure held
  24. 2013Figure held
  25. 2014Figure held
  26. 2015Figure held
  27. 2016Figure held
  28. 2017Figure held
  29. 2018Figure held
  30. 2019Figure held
  31. 2020Figure held
  32. 2021Figure held
  33. 2022Figure held
  34. 2023Figure held
  35. 2024Figure held
  36. 2025Figure held
  37. 2026Not researched yet
What was tried for the 3 years with no figure
2006–2008
  • Oxford FOI 202405/468 original workbook: school/cycle row identified by UCAS school ID, name, postcode and group; applications, offers and acceptances tokens transcribed with the literal <3 suppression band retained. This is a university admissions-cycle count, not a leaver destination.

Not searched yet: 1990–2005 and 2026. Their absence here tells you nothing about what the school published.

university acceptances

Covers places accepted, which are not confirmed destinations; no chart plots them. 17 of the 37 years from 1990 to 2026 hold a figure here, 3 were searched without one being recovered and 17 have not been searched yet.

  1. 1990Not researched yet
  2. 1991Not researched yet
  3. 1992Not researched yet
  4. 1993Not researched yet
  5. 1994Not researched yet
  6. 1995Not researched yet
  7. 1996Not researched yet
  8. 1997Not researched yet
  9. 1998Not researched yet
  10. 1999Not researched yet
  11. 2000Not researched yet
  12. 2001Not researched yet
  13. 2002Not researched yet
  14. 2003Not researched yet
  15. 2004Not researched yet
  16. 2005Not researched yet
  17. 2006No figure yet
  18. 2007No figure yet
  19. 2008No figure yet
  20. 2009Figure held
  21. 2010Figure held
  22. 2011Figure held
  23. 2012Figure held
  24. 2013Figure held
  25. 2014Figure held
  26. 2015Figure held
  27. 2016Figure held
  28. 2017Figure held
  29. 2018Figure held
  30. 2019Figure held
  31. 2020Figure held
  32. 2021Figure held
  33. 2022Figure held
  34. 2023Figure held
  35. 2024Figure held
  36. 2025Figure held
  37. 2026Not researched yet
What was tried for the 3 years with no figure
2006–2008
  • Oxford FOI 202405/468 original workbook: school/cycle row identified by UCAS school ID, name, postcode and group; applications, offers and acceptances tokens transcribed with the literal <3 suppression band retained. This is a university admissions-cycle count, not a leaver destination.

Not searched yet: 1990–2005 and 2026. Their absence here tells you nothing about what the school published.

university destinations

Covers where leavers actually went, read on the destinations page rather than as a chart. 1 of the 37 years from 1990 to 2026 hold a figure here and 36 have not been searched yet.

  1. 1990Not researched yet
  2. 1991Not researched yet
  3. 1992Not researched yet
  4. 1993Not researched yet
  5. 1994Not researched yet
  6. 1995Not researched yet
  7. 1996Not researched yet
  8. 1997Not researched yet
  9. 1998Not researched yet
  10. 1999Not researched yet
  11. 2000Not researched yet
  12. 2001Not researched yet
  13. 2002Not researched yet
  14. 2003Not researched yet
  15. 2004Not researched yet
  16. 2005Not researched yet
  17. 2006Not researched yet
  18. 2007Not researched yet
  19. 2008Not researched yet
  20. 2009Not researched yet
  21. 2010Not researched yet
  22. 2011Not researched yet
  23. 2012Not researched yet
  24. 2013Not researched yet
  25. 2014Figure held
  26. 2015Not researched yet
  27. 2016Not researched yet
  28. 2017Not researched yet
  29. 2018Not researched yet
  30. 2019Not researched yet
  31. 2020Not researched yet
  32. 2021Not researched yet
  33. 2022Not researched yet
  34. 2023Not researched yet
  35. 2024Not researched yet
  36. 2025Not researched yet
  37. 2026Not researched yet

Not searched yet: 1990–2013 and 2015–2026. Their absence here tells you nothing about what the school published.

More about this coverage table

Figures with different definitions, blank values or an unknown group counted remain available in the source records. Other qualifications appear in the full exam results.

Most recent recorded source check: 2026-09-06. This date applies to an individual publication, not every result on this page.

Explore the full school record

Open a subject below to see the figures, their sources and any limitations. A missing year or qualification means there is more to research.

School’s official website

Source evidenceOpen full record ↗