Eton College · sixth form · summer 2023
Eton College, sixth form 2023: 44.8% of 930 entries at A* or equivalent
Compared
44.8%
A* or equivalent, all sixth-form exams · Comparable figure · our calculation
of 930 entries. A level A* 380 + Pre-U D1–D2 37 = 417 of 930 entries
The school’s figure: 44.8% · A level and Pre-U combined, Pre-U grades converted. It matches TSR’s comparable figure (44.8%).
Grades as sat
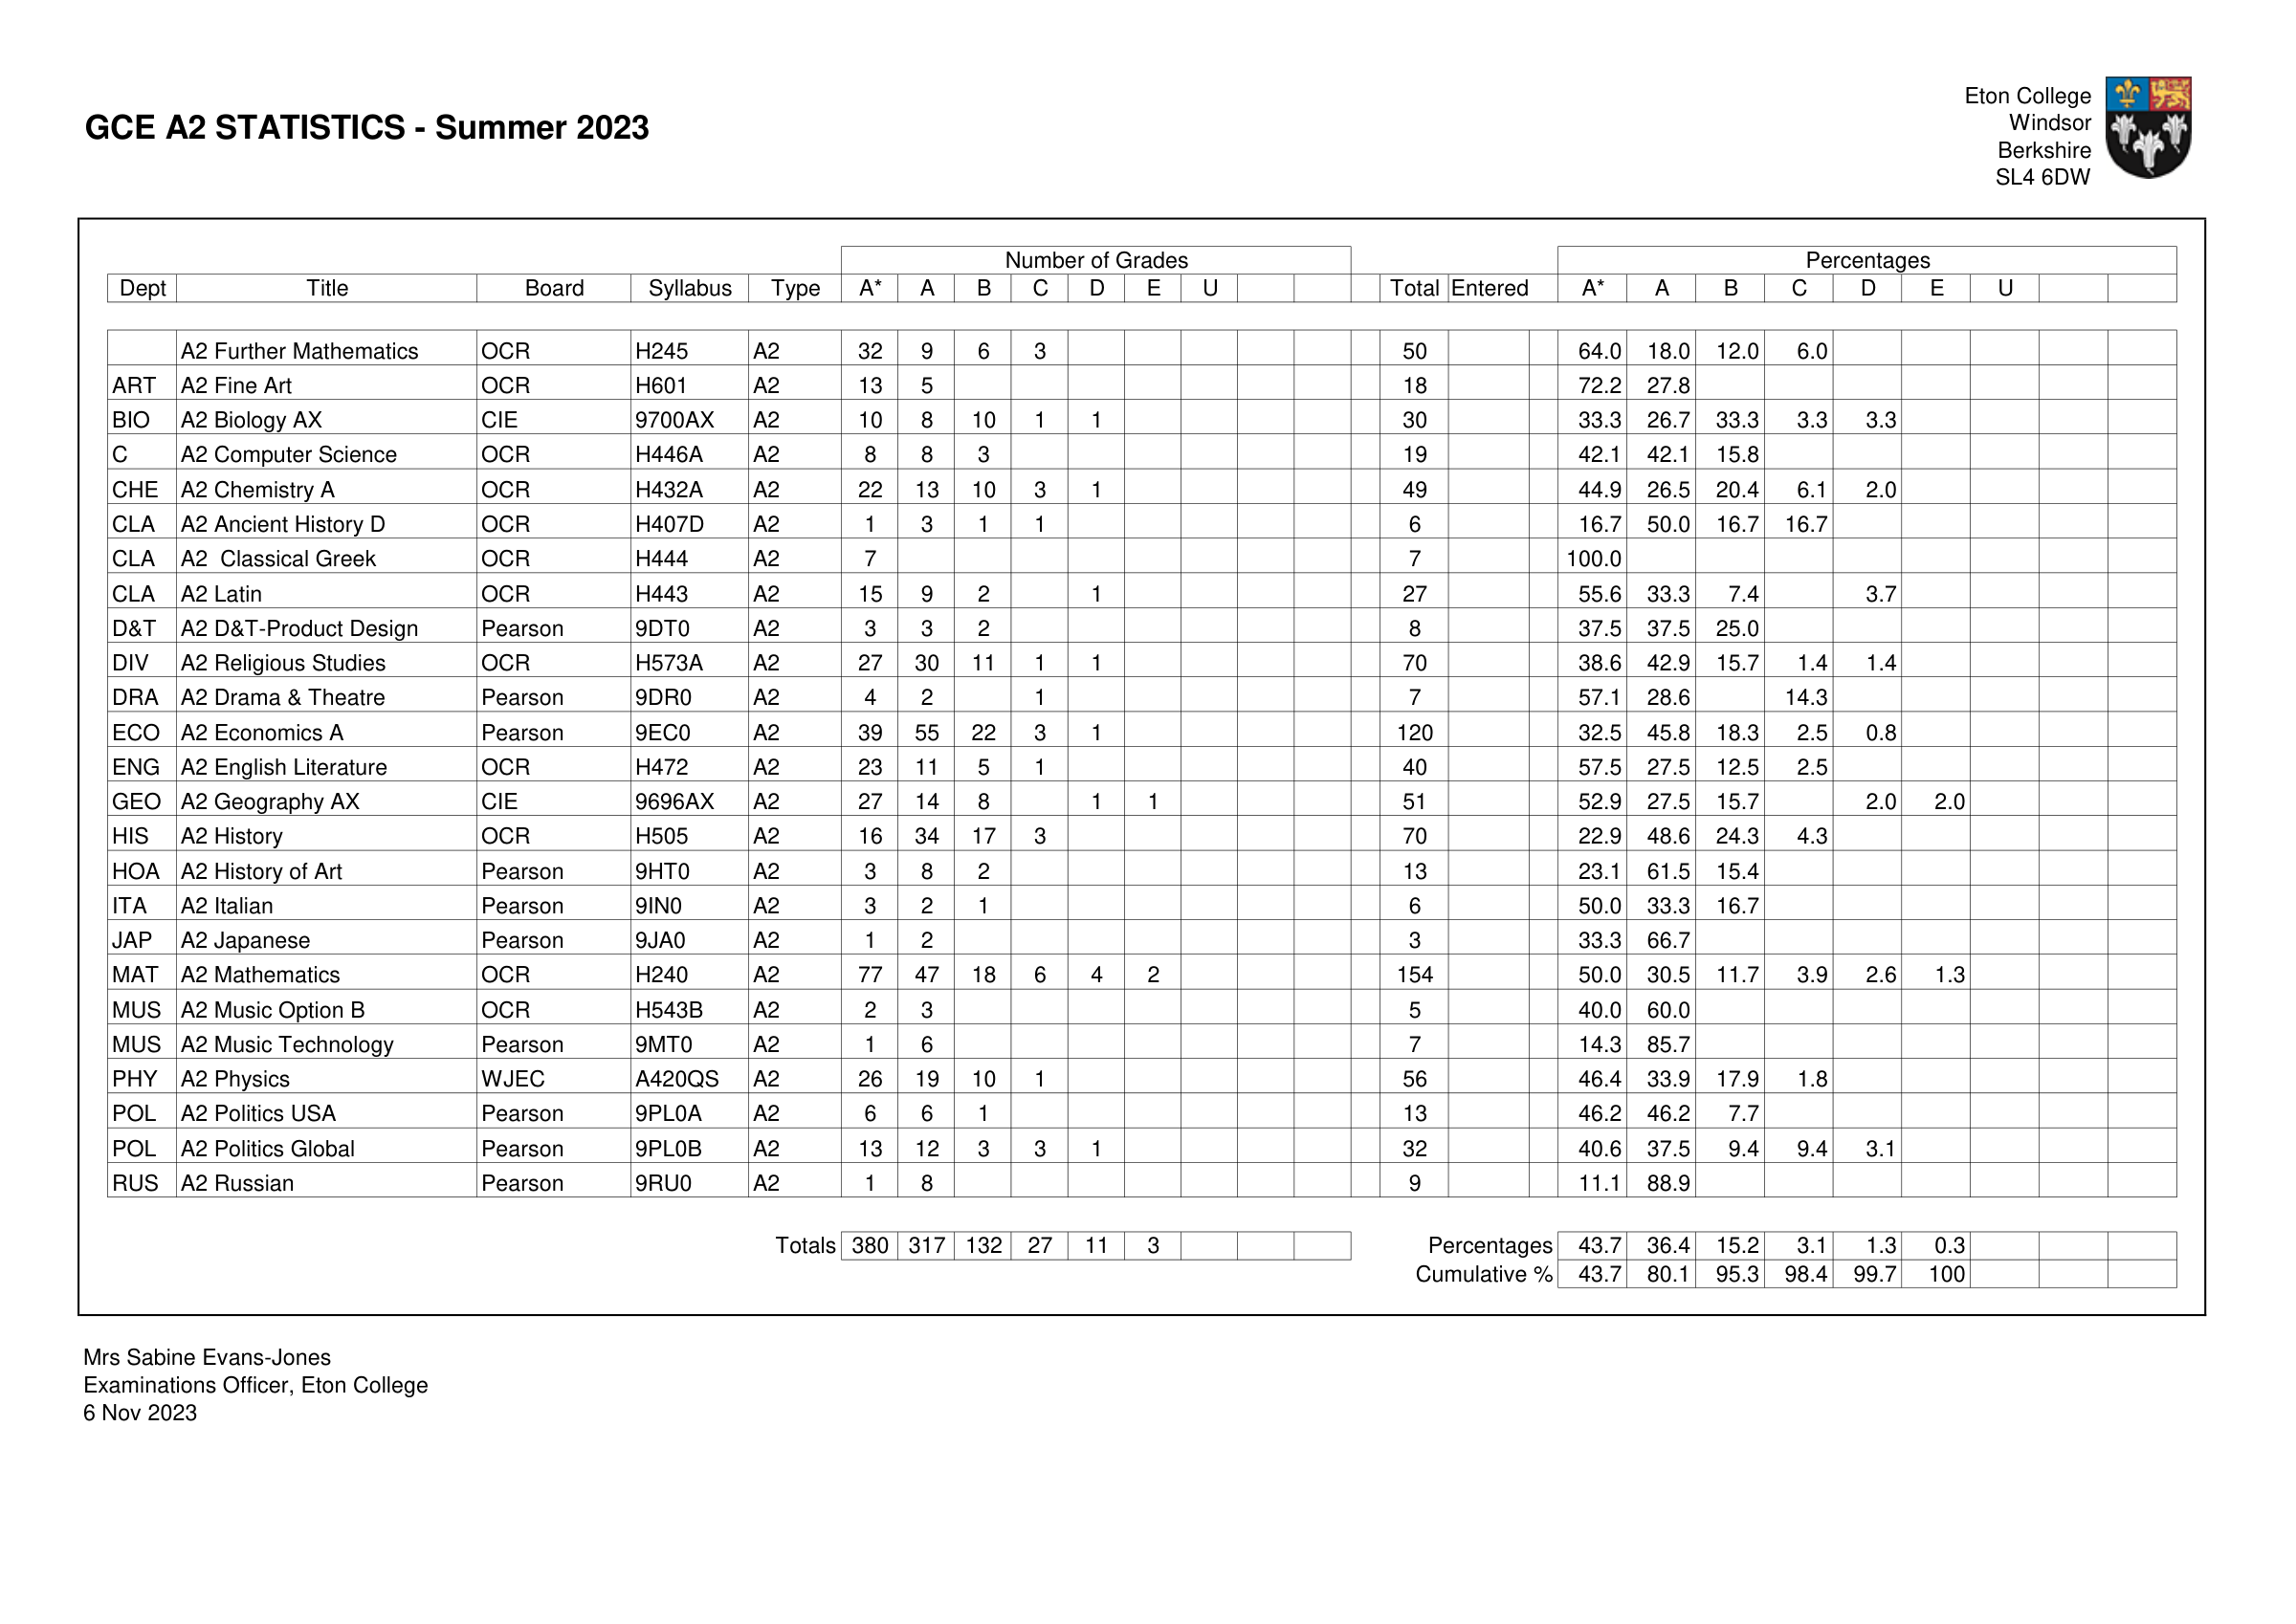
A level: A* 380 · A 317 · B 132 · C 27 · D 11 · E 3. Subjects and grades
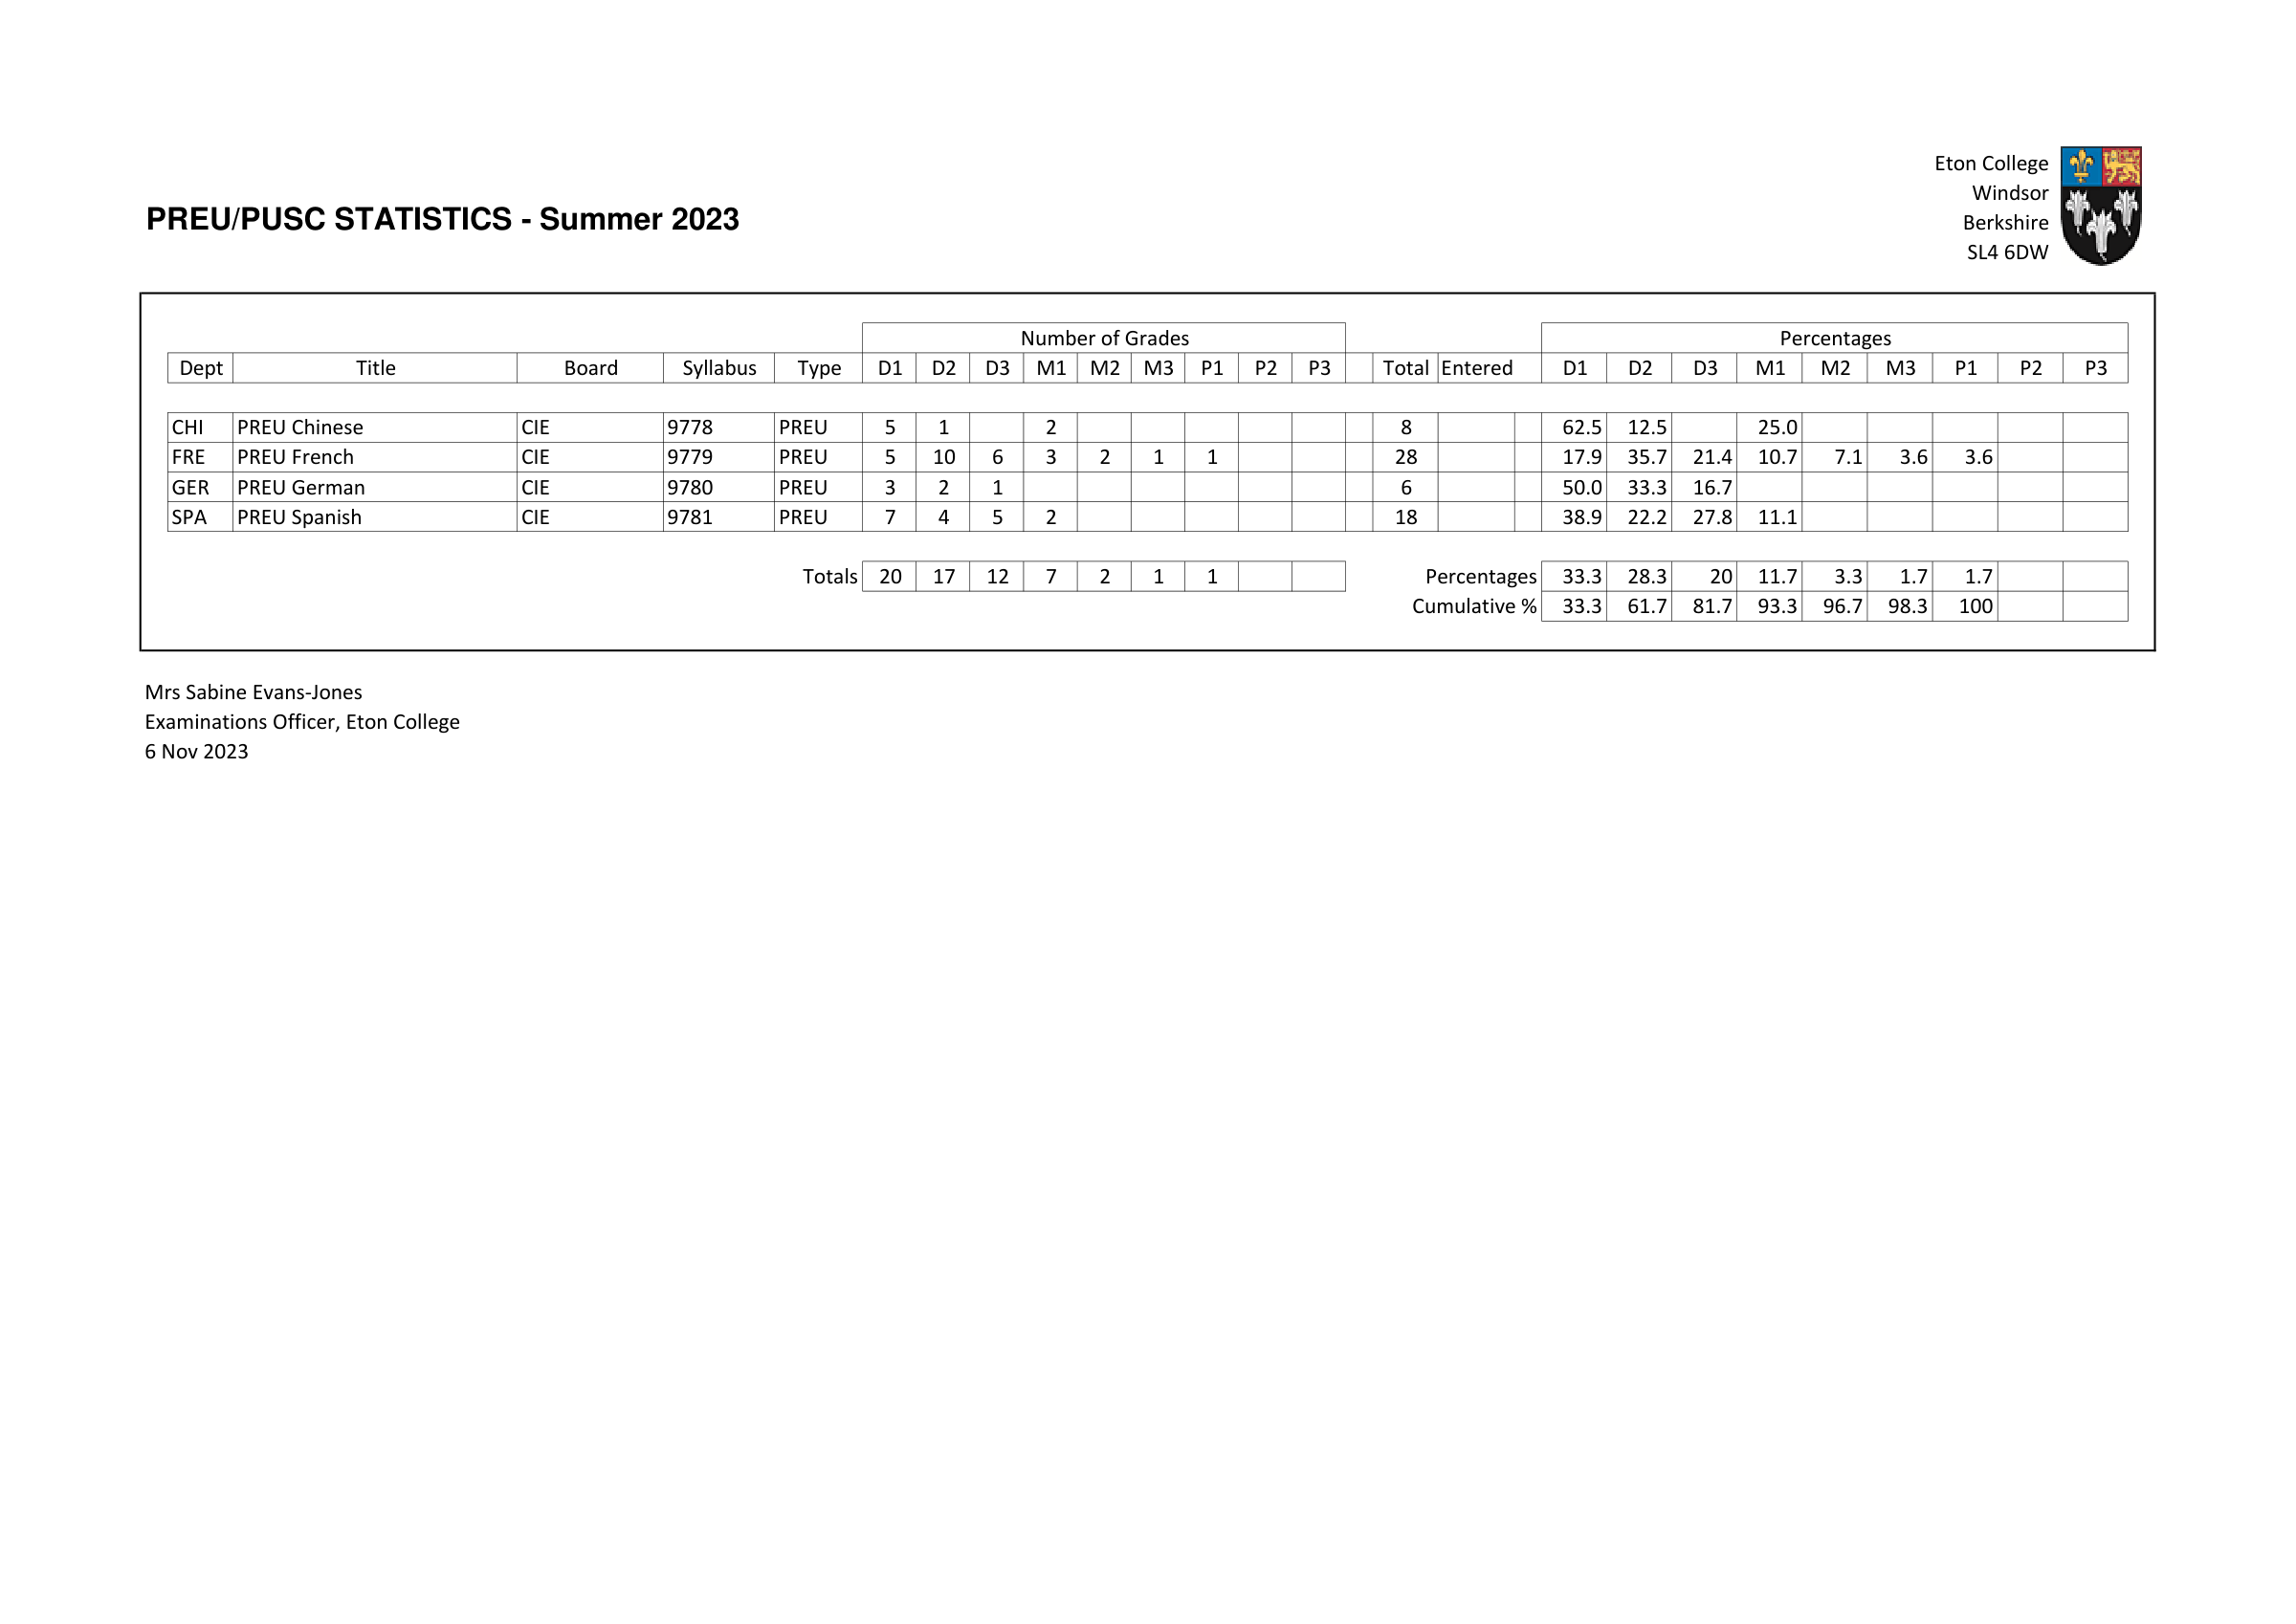
Pre-U: D1 20 · D2 17 · D3 12 · M1 7 · M2 2 · M3 1 · P1 1. Subjects and grades
This year’s exams: A levels and Pre-U.
We know because the government’s tables confirm it.
See both pagesSource pages: A*–A or equivalent, all sixth-form exams
Read these pagesThe page it came from
The marked rows are the ones used in this record. Open the original to read them in their full document.
A level
Dept Title Board Syllabus Type A* A B C D E U Total Entered A* A B C D E U
Totals 380 317 132 27 11 3 Percentages 43.7 36.4 15.2 3.1 1.3 0.3
Cumulative % 43.7 80.1 95.3 98.4 99.7 100
Eton College GCE A2 Statistics Summer 2023 · PDF page 1. Open the original
Pre-U
Dept Title Board Syllabus Type D1 D2 D3 M1 M2 M3 P1 P2 P3 Total Entered D1 D2 D3 M1 M2 M3 P1 P2 P3
Totals 20 17 12 7 2 1 1 Percentages 33.3 28.3 20 11.7 3.3 1.7 1.7
Cumulative % 33.3 61.7 81.7 93.3 96.7 98.3 100
Eton College PREU/PUSC statistics, summer 2023 · PDF page 1. Open the original
Our figure · A*–A or equiv.
80.2%
of 930 entries
A level A*–A 697 + Pre-U D1–D3 49 = 746 of 930 entries
How we built itThe page it came from
The marked rows are the ones used in this record. Open the original to read them in their full document.
A level
Dept Title Board Syllabus Type A* A B C D E U Total Entered A* A B C D E U
Totals 380 317 132 27 11 3 Percentages 43.7 36.4 15.2 3.1 1.3 0.3
Cumulative % 43.7 80.1 95.3 98.4 99.7 100
Eton College GCE A2 Statistics Summer 2023 · PDF page 1. Open the original
Pre-U
Dept Title Board Syllabus Type D1 D2 D3 M1 M2 M3 P1 P2 P3 Total Entered D1 D2 D3 M1 M2 M3 P1 P2 P3
Totals 20 17 12 7 2 1 1 Percentages 33.3 28.3 20 11.7 3.3 1.7 1.7
Cumulative % 33.3 61.7 81.7 93.3 96.7 98.3 100
Eton College PREU/PUSC statistics, summer 2023 · PDF page 1. Open the original
Our figure · A* or equiv.
44.8%
of 930 entries
A level A* 380 + Pre-U D1–D2 37 = 417 of 930 entries
How we built itSource pages: A*–B or equivalent, all sixth-form exams
Read these pagesThe page it came from
The marked rows are the ones used in this record. Open the original to read them in their full document.
A level
Dept Title Board Syllabus Type A* A B C D E U Total Entered A* A B C D E U
Totals 380 317 132 27 11 3 Percentages 43.7 36.4 15.2 3.1 1.3 0.3
Cumulative % 43.7 80.1 95.3 98.4 99.7 100
Eton College GCE A2 Statistics Summer 2023 · PDF page 1. Open the original
Pre-U
Dept Title Board Syllabus Type D1 D2 D3 M1 M2 M3 P1 P2 P3 Total Entered D1 D2 D3 M1 M2 M3 P1 P2 P3
Totals 20 17 12 7 2 1 1 Percentages 33.3 28.3 20 11.7 3.3 1.7 1.7
Cumulative % 33.3 61.7 81.7 93.3 96.7 98.3 100
Eton College PREU/PUSC statistics, summer 2023 · PDF page 1. Open the original
Our figure · A*–B or equiv.
95.4%
of 930 entries
A level A*–B 829 + Pre-U D1–M2 58 = 887 of 930 entries
How we built it| Grade band | Comparable figure (our calculation) | The school’s figure (as the school published it) | Original grades |
|---|---|---|---|
| A*–A or equivalent, all sixth-form examsCambridge aligns Pre-U D3 with A and UCAS scores IB 6 like an A. | 80.2% of 930 entries | 80.2% · A level and Pre-U combined, Pre-U grades convertedIt matches TSR’s comparable figure (80.2%). | A level: A*–A 80.1% of 870 Pre-U: D1–D3 81.7% of 60 |
| A* or equivalent, all sixth-form exams | 44.8% of 930 entries | 44.8% · A level and Pre-U combined, Pre-U grades convertedIt matches TSR’s comparable figure (44.8%). | A level: A* 43.7% of 870 Pre-U: D1–D2 61.7% of 60 |
| A*–B or equivalent, all sixth-form exams | 95.4% of 930 entries | 95.4% · A level and Pre-U combined, Pre-U grades convertedIt matches TSR’s comparable figure (95.4%). | A level: A*–B 95.3% of 870 Pre-U: D1–M2 96.7% of 60 |
How we built it
The number of entries at or above the band, across every exam system, divided by all the entries. We never average two percentages.
- A*–A or equiv.: A level A*–A 697 + Pre-U D1–D3 49 = 746 of 930 entries
- A* or equiv.: A level A* 380 + Pre-U D1–D2 37 = 417 of 930 entries
- A*–B or equiv.: A level A*–B 829 + Pre-U D1–M2 58 = 887 of 930 entries
The records it is built from
- A level, 870 entries: Eton College, A level 2023: All published A-level subjects
- Pre-U, 60 entries: Eton College, Pre-U 2023: 81.7% of entries at D1–D3
Cite this figure
Eton College, 2023, A* or equivalent, all sixth-form exams: 44.8% (comparable figure, our calculation; A level A* 380 + Pre-U D1–D2 37 = 417 of 930 entries). Method harm-v1. Records: new:eton:2023:school-final-a-level-distribution, research:eton:2023:pre-u:original-sheet. The Schools Record, https://theschoolsrecord.co.uk/evidence/harm:v1:eton:2023:sixth-form/
Record details
Record ID harm:v1:eton:2023:sixth-form. Quote it if you report a problem.
As recorded
The record’s own wording, where this page puts it in plainer words.
- A*–A or equiv.: basis
- Weighted by entries across A level and Pre-U
- A*–A or equiv.: precision
- Exact, from printed counts
- A* or equiv.: basis
- Weighted by entries across A level and Pre-U
- A* or equiv.: precision
- Exact, from printed counts
- A*–B or equiv.: basis
- Weighted by entries across A level and Pre-U
- A*–B or equiv.: precision
- Exact, from printed counts
- A level: entries
- 870 (sum of printed grade counts (they reproduce every printed percentage))
- Pre-U: entries
- 60 (sum of printed grade counts (they reproduce every printed percentage))
- Which exams were sat: evidence
- A level: 29 school or ISC records (e.g. fig:eton_alevel_headline_gap_years:9); 45 DfE rows (e.g. new:eton:2023:dfe-ks5-institution-aggregated-results-13218)
- Which exams were sat: evidence
- Pre-U: 3 school or ISC records (e.g. new:eton:2023:preu-annual-report-labels); 11 DfE rows (e.g. new:eton:2023:dfe-ks5-institution-aggregated-results-13225)
- The school’s figure
- The school’s figure: A level and Pre-U combined, Pre-U grades converted (settled eton-2023-a-level-population) (fig:eton_alevel_headline_gap_years:9)
Source references
OLDER_ETON_AL_2023_FINAL· Eton College GCE A2 Statistics Summer2023REV_4BFD2B6542BF· Eton College PREU/PUSC statistics, summer 2023
Method and version
- Method
harm-v1 1.0.0- Inputs digest
sha256:62a63696da017b3c1e0392aa7f75629636e7a82a09243e59998389ee08324e2d- Qualification mix
A level, Pre-U (government-table)