Eton College · A level · summer 2023
Eton College, A level 2023: All published A-level subjects
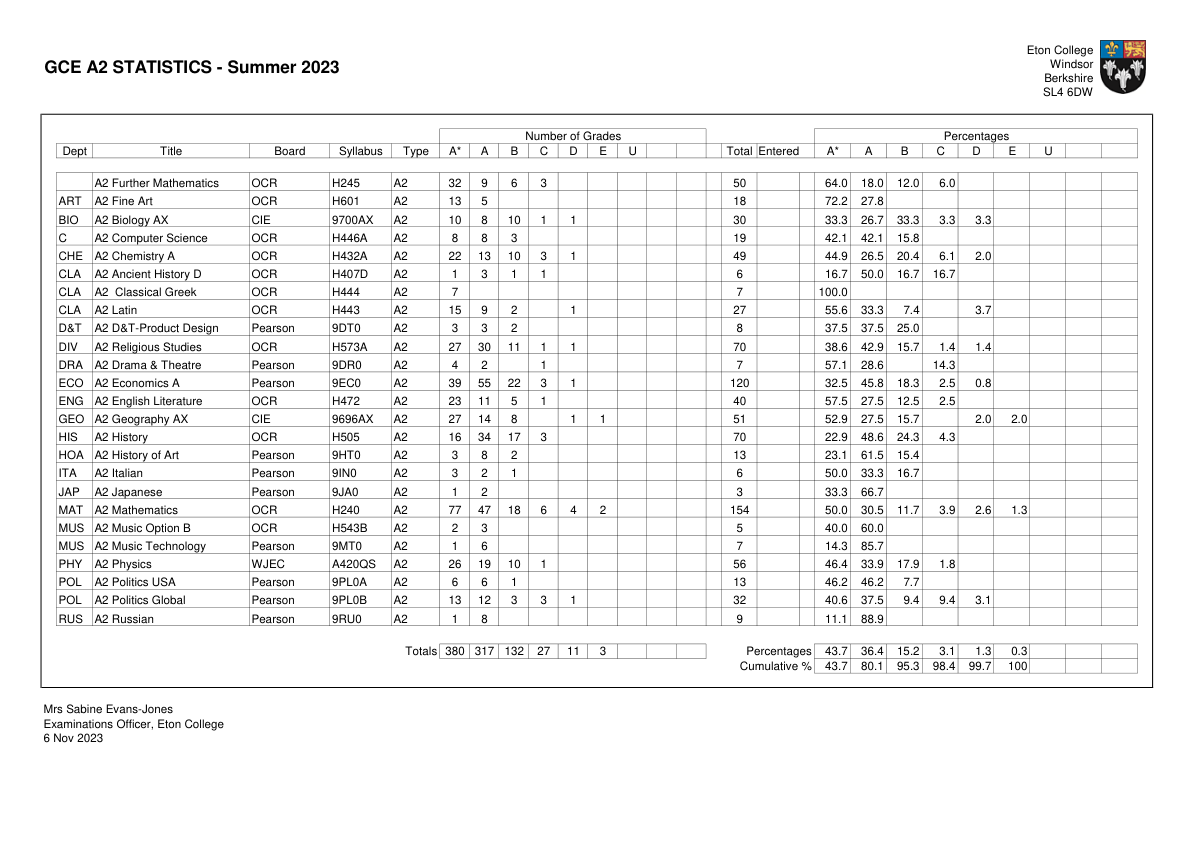
Checked against the original: 10 figures, including A* count, A* and A*–A.
What it counts
Original Totals and Cumulative% rows. Overall entries are not printed as a headline cell; no calculated sum is assigned as an original entry count.
The page it came from
The highlighted rows show where these figures came from. Open the original if you would like to read what surrounds them.
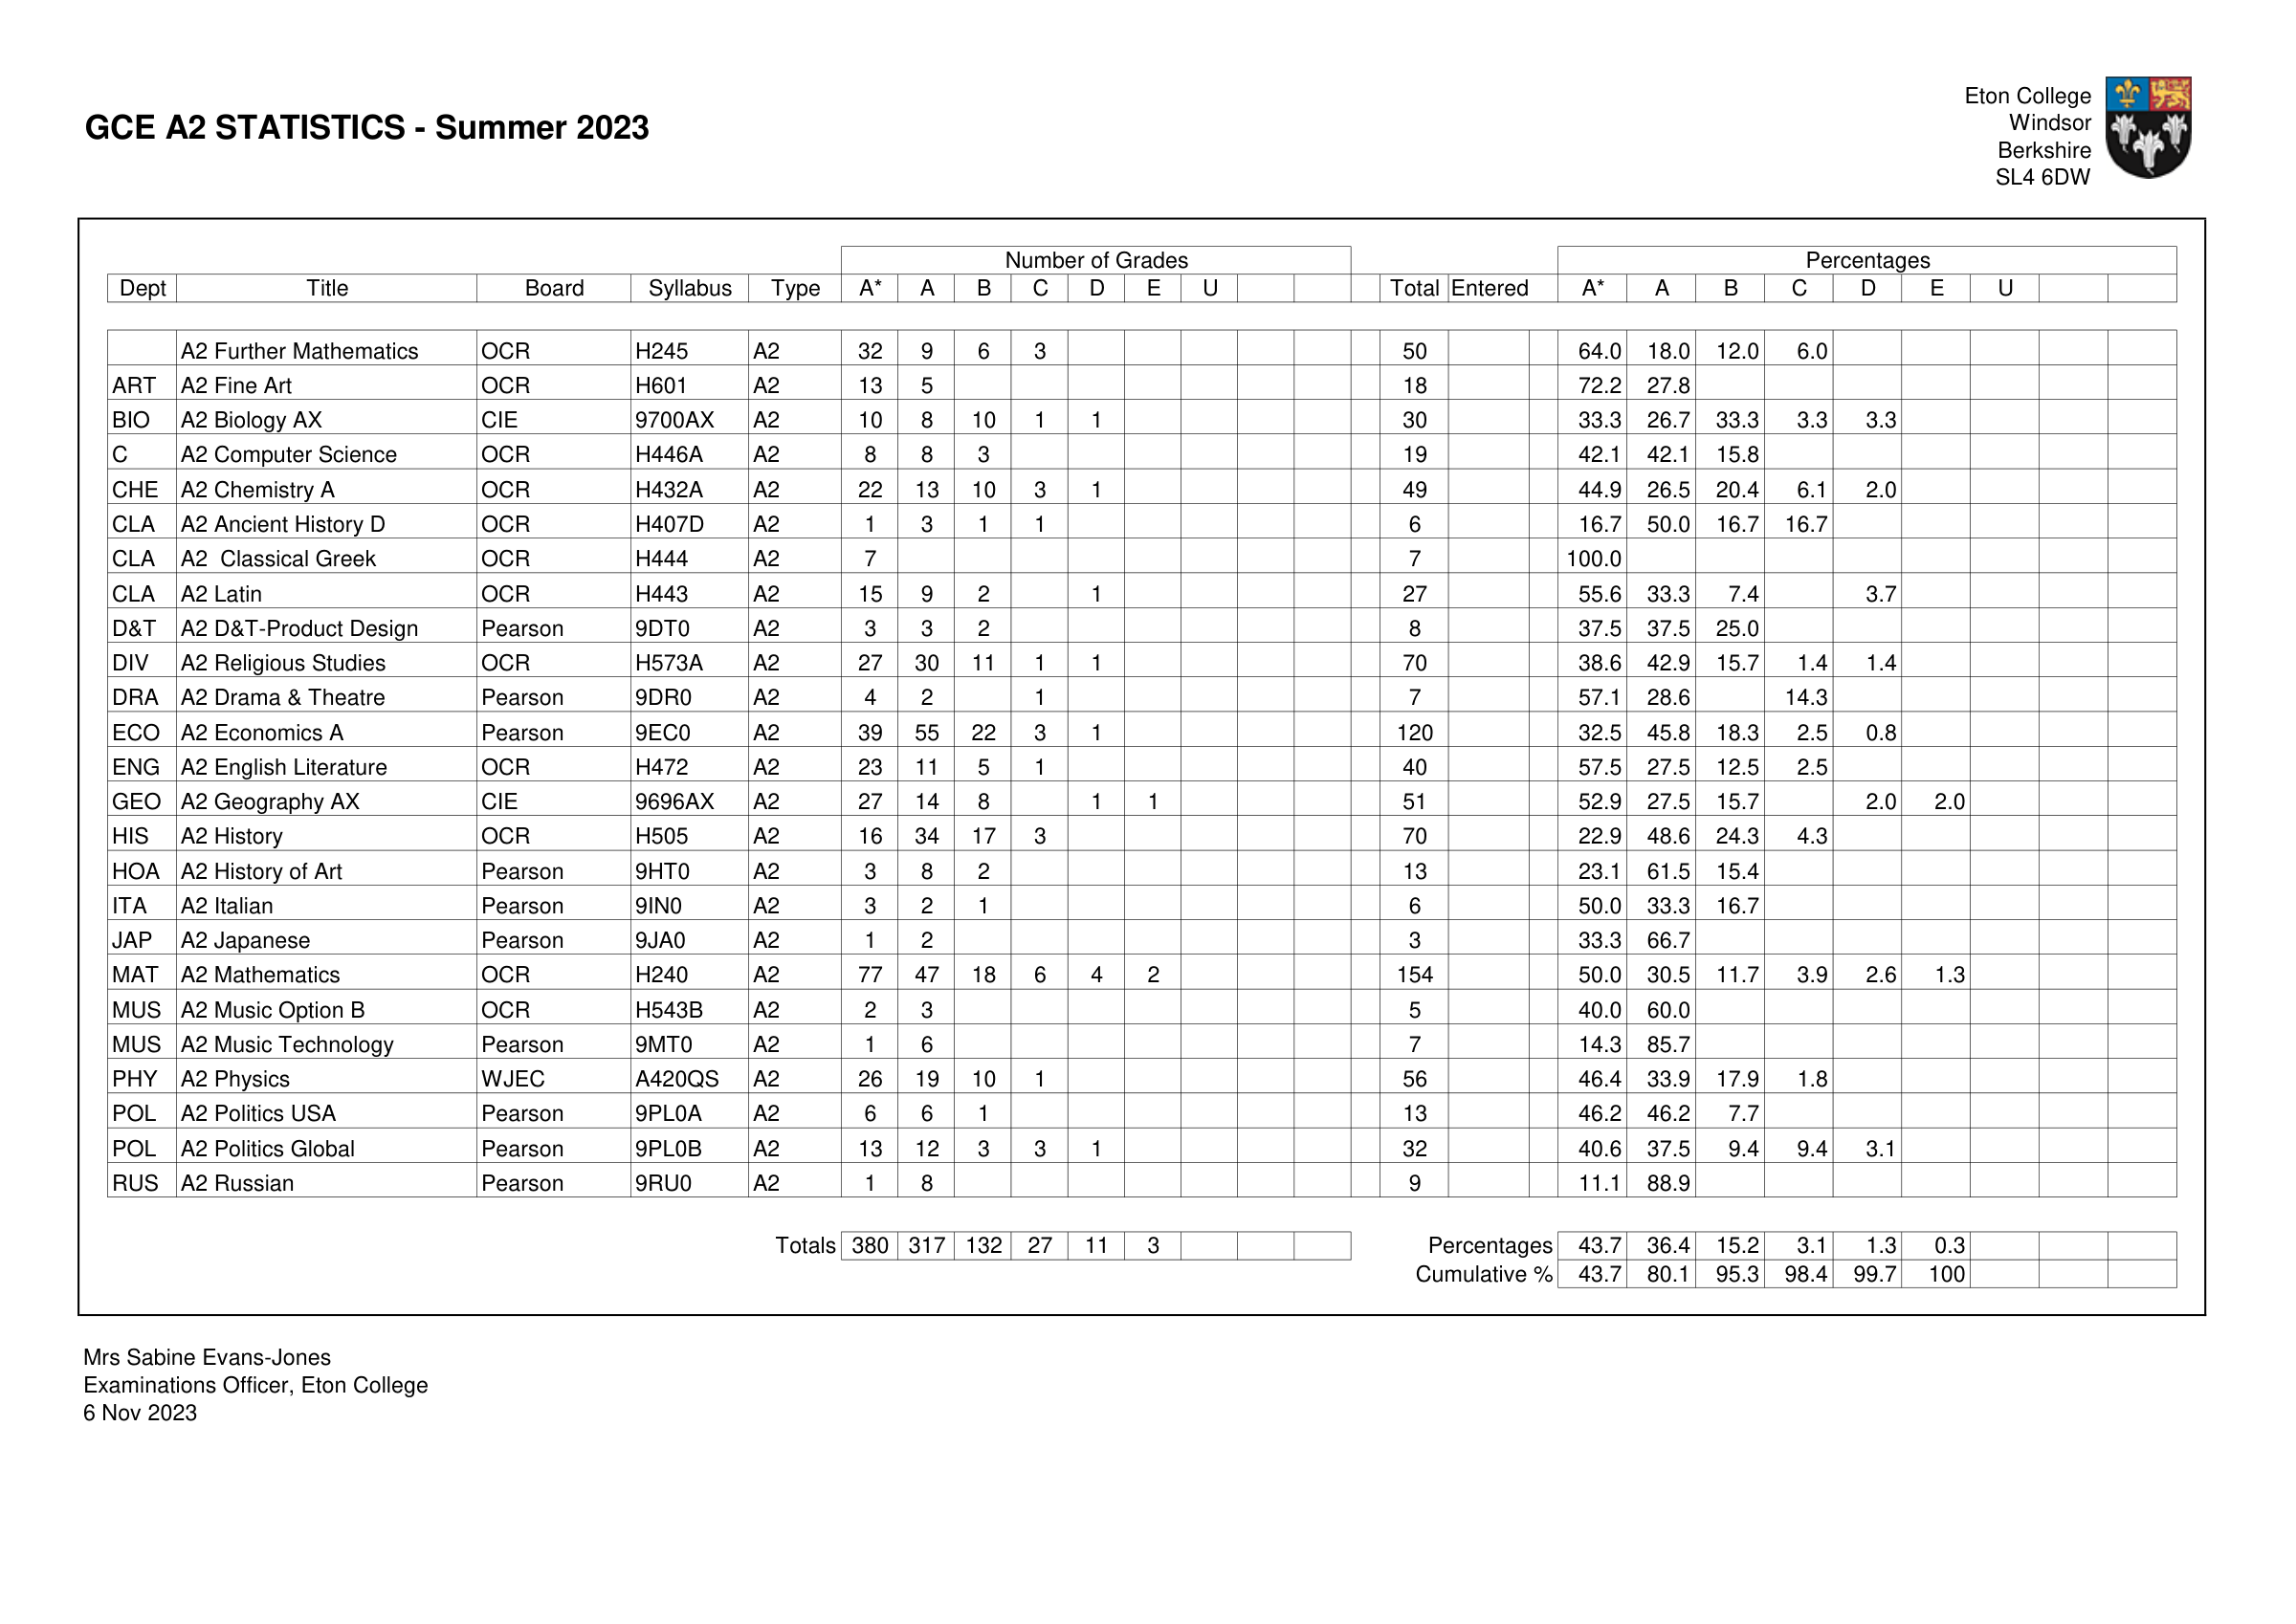
A level
Dept Title Board Syllabus Type A* A B C D E U Total Entered A* A B C D E U
Totals 380 317 132 27 11 3 Percentages 43.7 36.4 15.2 3.1 1.3 0.3
Cumulative % 43.7 80.1 95.3 98.4 99.7 100
Eton College GCE A2 Statistics Summer 2023 · PDF page 1. Open the original
The figures
As printed. Percentages are of subject entries, not pupils.
- A*
- 43.7
- A*–A
- 80.1
- A*–B
- 95.3
- A* count
- 380
- A count
- 317
- B count
- 132
- C count
- 27
- D count
- 11
- E count
- 3
- Qualification
- A-level
- Qualification, as the source names it
- A2
- The subject
- All published A-level subjects
- Pass
- 100
Notes and original wording (5)
- What it counts
- Original Totals and Cumulative% rows. Overall entries are not printed as a headline cell; no calculated sum is assigned as an original entry count.
- Note
- Source percentages retain the original precision. A-level is distinct from Pre-U and IB. The original table differs from the preserved register; both versions remain visible, with no preferred version established. Update 23 Sep 2026: Different groups counted. Eton’s 2023 figures of 44.8 / 80.2 / 95.4% count A-level and Pre-U entries together (930 entries), not A level alone.
- Who is counted
- School-published examination-grade entries
- Publication status
- Publication versions reconciled on 23 Sep 2026: Different groups counted
- Year
- 2023
Where it was published
-
Eton College GCE A2 Statistics Summer 2023
PDF page 1, Totals / Cumulative% rows · Checked 6 Sep 2026
matches 10 figures, including A* count, A count and B count
Notes on this record
- Where it’s from
- Publication versions reconciled on 23 Sep 2026: Different groups counted
- Worth knowing
- Source percentages retain the original precision. A-level is distinct from Pre-U and IB. The original table differs from our compiled record; both versions remain visible, with no preferred version established. Update 23 Sep 2026: Different groups counted. Eton’s 2023 figures of 44.8 / 80.2 / 95.4% count A-level and Pre-U entries together (930 entries), not A level alone.
- How the source defines it
- Original Totals and Cumulative% rows. Overall entries are not printed as a headline cell; no calculated sum is assigned as an original entry count.
Revision log
A figure can change between the first announcement and a later publication. Here you can see what changed, how we checked it and how we applied the published rules. Earlier versions remain available.
Different groups counted · logged · Correction C31
Eton’s 2023 figures of 44.8 / 80.2 / 95.4% count A-level and Pre-U entries together (930 entries), not A level alone.
- A*, A*–A, A*–B: A-level subject entries · in the A-level series
What was checked
The record held 44.8 / 80.2 / 95.4% (A* / A*–A / A*–B) as A-level results. Each figure is reproduced exactly, at its printed precision, by Eton’s A-level table (870 entries) and Pre-U table (60 entries) added together, with Pre-U Distinction 1 and 2 counted as A*, Distinction 3 as A and Merit 1 and 2 as B: A* 44.84%; A*–A 80.22%; A*–B 95.38%. The A-level table alone gives A* 43.68%, A*–A 80.11%, A*–B 95.29%. The two sets count different groups of entries, so both are shown, each labelled, and only the A-level table enters the A-level comparison. Eton’s 2022/23 annual report prints 80.1% A*–A and 95.3% A*–B for A level, the A-level table’s figures. The A-level table enters the A-level series; its 870 entries are the sum of its printed grade totals.
- Eton College GCE A2 Statistics, Summer 2023 · signed · checked
- Eton College Pre-U/PUSC Statistics, Summer 2023 · signed · checked
- Eton College Annual Report and Financial Statements 2022/23 (printed page 14) · checked
Can I compare it?
- A*, A*–A and A*–B: yes, with another school’s figure for the same year, counting a-level subject entries on the same grading scale (A-level post-2010 A*–E).
Record details
Record ID new:eton:2023:school-final-a-level-distribution. Quote it if you report a problem.
As recorded
The record’s own wording, where this page puts it in plainer words.
- Note
- Source percentages retain the original precision. A-level is distinct from Pre-U and IB. The original table differs from the preserved register; both versions remain visible, with no preferred version established. Update 23 Sep 2026: Different groups counted. Eton’s 2023 figures of 44.8 / 80.2 / 95.4% count A-level and Pre-U entries together (930 entries), not A level alone.
- Collection note
- Source percentages retain the original precision. A-level is distinct from Pre-U and IB. The original table differs from the preserved register; both versions remain visible, with no preferred version established.
Source references
OLDER_ETON_AL_2023_FINAL· Eton College GCE A2 Statistics Summer2023
Codes and identifiers
- Evidence
- P
- Record Id
- new:eton:2023:school-final-a-level-distribution
Comparison codes
a_star· eligible when the year and group match · exact · 0 decimal places · origin Pa_star_a· eligible when the year and group match · exact · 0 decimal places · origin Pa_star_b· eligible when the year and group match · exact · 0 decimal places · origin P
Check log
- 2026-09-06 ·
a_star_count· verified · Eton College GCE A2 Statistics Summer2023 · PDF page1; Totals / Cumulative% rows - 2026-09-06 ·
a_count· verified · Eton College GCE A2 Statistics Summer2023 · PDF page1; Totals / Cumulative% rows - 2026-09-06 ·
b_count· verified · Eton College GCE A2 Statistics Summer2023 · PDF page1; Totals / Cumulative% rows - 2026-09-06 ·
c_count· verified · Eton College GCE A2 Statistics Summer2023 · PDF page1; Totals / Cumulative% rows - 2026-09-06 ·
d_count· verified · Eton College GCE A2 Statistics Summer2023 · PDF page1; Totals / Cumulative% rows - 2026-09-06 ·
e_count· verified · Eton College GCE A2 Statistics Summer2023 · PDF page1; Totals / Cumulative% rows - 2026-09-06 ·
a_star· verified · Eton College GCE A2 Statistics Summer2023 · PDF page1; Totals / Cumulative% rows - 2026-09-06 ·
a_star_a· verified · Eton College GCE A2 Statistics Summer2023 · PDF page1; Totals / Cumulative% rows - 2026-09-06 ·
a_star_b· verified · Eton College GCE A2 Statistics Summer2023 · PDF page1; Totals / Cumulative% rows - 2026-09-06 ·
pass· verified · Eton College GCE A2 Statistics Summer2023 · PDF page1; Totals / Cumulative% rows
All Eton College records like this · Report a problem with this figure (opens an email to corrections@theschoolsrecord.co.uk, or write a fuller report)