Eton College · A level · summer 2026
Eton College, A level 2026: 38.3% of 911 entries graded A*
38.3%
75.1% A*–A · 94.1% A*–B
Checked against the original
Eton College GCE Summer 2026 Statistics, PDF page 1 · published 9 Nov 2026 Open original: Eton College GCE Summer 2026 Statistics
Report a problemCite
Eton College. A-level entries graded A*: 38.3% of 911 entries, summer 2026 exams. Status: Checked against the original. Source: Eton College GCE Summer 2026 Statistics, published 9 Nov 2026, PDF page 1, https://www.etoncollege.com/wp-content/uploads/2026/11/GCE-Summer-2026-Statistics.pdf. Checked by The Schools Record on 11 November 2026. The Schools Record, https://theschoolsrecord.co.uk/evidence/research:eton:2026:school-sheet-a-level-distribution/
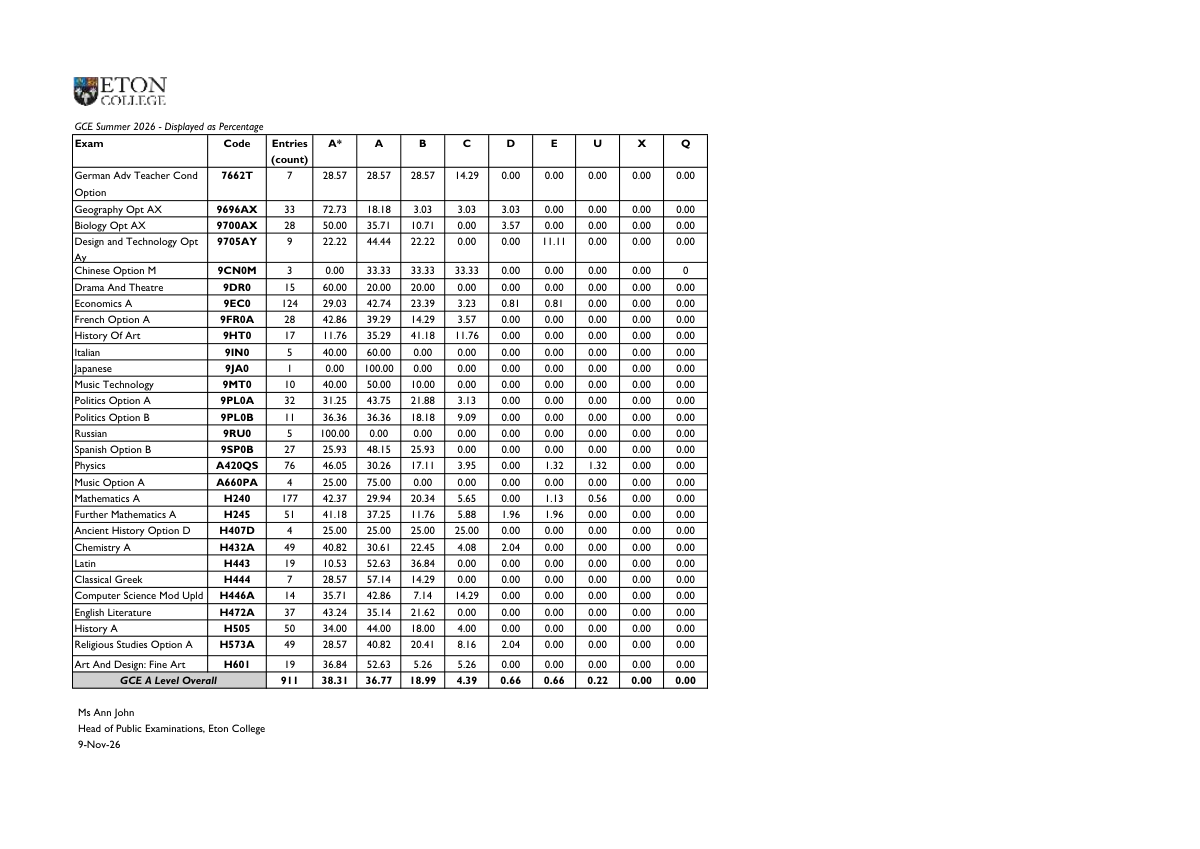
Checked against the original: 12 figures, including A* count, A* and A*–A.
What it counts
School-published original results on the printed qualification scale. Counts describe subject/examination entries, not an inferred pupil cohort. The sheet is headed “Displayed as Percentage”: grade counts are the printed entries multiplied by each printed percentage, and every one reproduces its printed percentage exactly. Grades with no entries are not recorded as counts. The sheet is signed 9 November 2026 and is not labelled final. Whole-school totals and cumulative percentages from the Overall row. The sheet also prints X and Q columns, both zero.
The page it came from
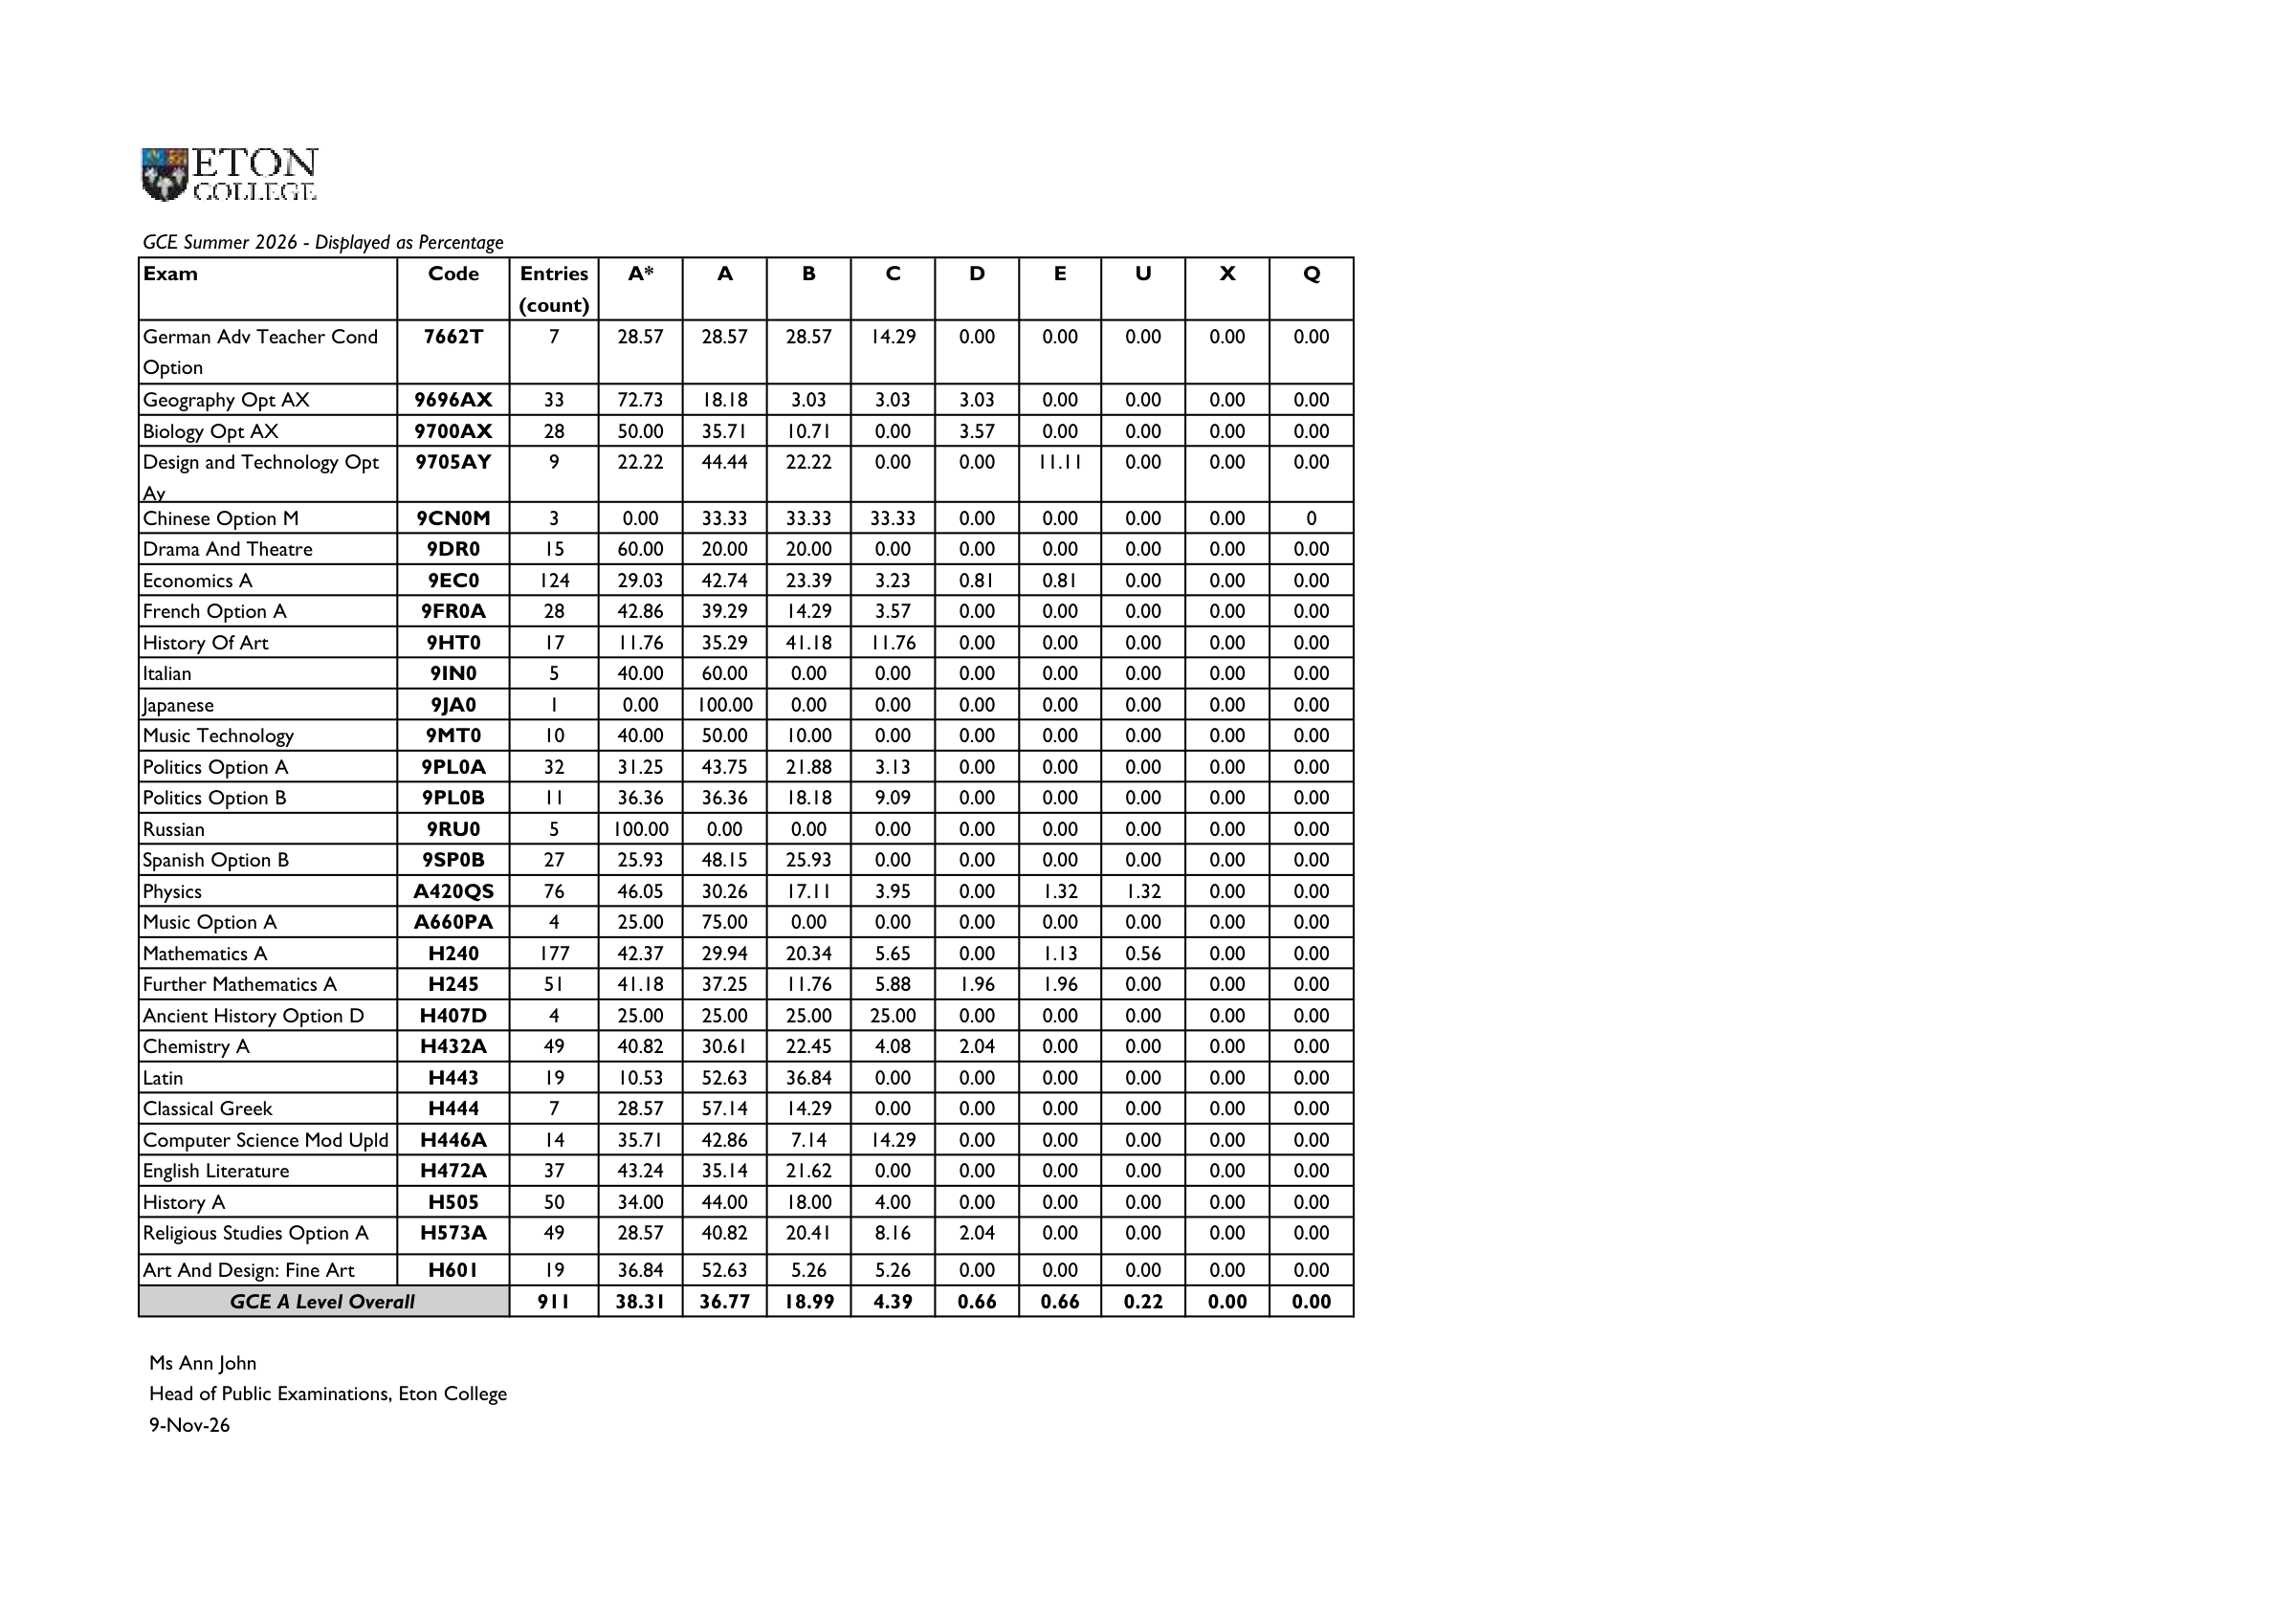
The highlighted rows show where these figures came from. Open the original if you would like to read what surrounds them.
A level
Exam Code Entries (count) A* A B C D E U X Q
GCE A Level Overall 911 38.31 36.77 18.99 4.39 0.66 0.66 0.22 0.00 0.00
Eton College GCE Summer 2026 Statistics · PDF page 1. Open the original
The figures
As printed. Percentages are of subject entries, not pupils.
- Entries
- 911
- A*
- 38.3
- A*–A
- 75.1
- A*–B
- 94.1
- A* count
- 349
- A count
- 335
- B count
- 173
- C count
- 40
- D count
- 6
- E count
- 6
- U count
- 2
- Qualification
- A-level
- Qualification, as the source names it
- GCE A Level
- Pass
- 99.8
- Grade scale
- A*–E
Notes and original wording (4)
- What it counts
- School-published original results on the printed qualification scale. Counts describe subject/examination entries, not an inferred pupil cohort. The sheet is headed “Displayed as Percentage”: grade counts are the printed entries multiplied by each printed percentage, and every one reproduces its printed percentage exactly. Grades with no entries are not recorded as counts. The sheet is signed 9 November 2026 and is not labelled final. Whole-school totals and cumulative percentages from the Overall row. The sheet also prints X and Q columns, both zero.
- Note
- School-published original results on the printed qualification scale. Counts describe subject/examination entries, not an inferred pupil cohort. The sheet is headed “Displayed as Percentage”: grade counts are the printed entries multiplied by each printed percentage, and every one reproduces its printed percentage exactly. Grades with no entries are not recorded as counts. The sheet is signed 9 November 2026 and is not labelled final. Whole-school totals and cumulative percentages from the Overall row. The sheet also prints X and Q columns, both zero.
- Who is counted
- School-published subject-grade entries
- Year
- 2026
Where it was published
-
Eton College GCE Summer 2026 Statistics
PDF page 1, GCE A Level Overall row, Entries column; PDF page 1, GCE A Level Overall row, A* column; PDF page 1, GCE A Level Overall row, A column; PDF page 1, GCE A Level Overall row, B column; PDF page 1, GCE A Level Overall row, C column; PDF page 1, GCE A Level Overall row, D column; PDF page 1, GCE A Level Overall row, E column; PDF page 1, GCE A Level Overall row, U column; PDF page 1, Percentages and cumulative rows (A*, A*–A, A*–B); PDF page 1, Cumulative A*–E · Checked 11 Nov 2026
matches 12 figures, including entries, A* count and A count
Entries: Signed Ms Ann John, Head of Public Examinations, Eton College, 9-Nov-26.
7 figures, including A* count, A count and B count: Calculated from the printed entries and the printed percentage; the percentage is reproduced exactly, and the subject rows sum to the whole-school count.
A*, A*–A, A*–B and pass: Checked against the original. The sheet prints this percentage to two decimals; it is recorded at one decimal, which the grade counts reproduce, as Eton’s earlier sheets are shown.
Also named as a source:
Notes on this record
- Where it’s from
- Original publication
- Worth knowing
- School-published original results on the printed qualification scale. Counts describe subject/examination entries, not an inferred pupil cohort. The sheet is headed “Displayed as Percentage”: grade counts are the printed entries multiplied by each printed percentage, and every one reproduces its printed percentage exactly. Grades with no entries are not recorded as counts. The sheet is signed 9 November 2026 and is not labelled final. Whole-school totals and cumulative percentages from the Overall row. The sheet also prints X and Q columns, both zero.
Can I compare it?
- A*, A*–A and A*–B: yes, with another school’s figure for the same year, counting a-level subject entries on the same grading scale (A-level post-2010 A*–E).
Record details
Record ID research:eton:2026:school-sheet-a-level-distribution. Quote it if you report a problem.
As recorded
The record’s own wording, where this page puts it in plainer words.
- Collection note
- School-published original results on the printed qualification scale. Counts describe subject/examination entries, not an inferred pupil cohort. The sheet is headed “Displayed as Percentage”: grade counts are the printed entries multiplied by each printed percentage, and every one reproduces its printed percentage exactly. Grades with no entries are not recorded as counts. The sheet is signed 9 November 2026 and is not labelled final. Whole-school totals and cumulative percentages from the Overall row. The sheet also prints X and Q columns, both zero.
- Check note (entries)
- Signed Ms Ann John, Head of Public Examinations, Eton College, 9-Nov-26.
- Check note (7 figures, including A* count, A count and B count)
- Calculated from the printed entries and the printed percentage; the percentage is reproduced exactly, and the subject rows sum to the whole-school count.
- Check note (A*, A*–A, A*–B and pass)
- Checked against the original. The sheet prints this percentage to two decimals; it is recorded at one decimal, which the grade counts reproduce, as Eton’s earlier sheets are shown.
- Source note
- Primary
Source references
ETON_2026_GCE_STATISTICS_PDF· Eton College GCE Summer 2026 StatisticsETON_2026_EXAM_RESULTS_HUB_20261111· Eton College exam results · Official school index establishing document provenance
Codes and identifiers
- Evidence
- P
- Record Id
- research:eton:2026:school-sheet-a-level-distribution
Comparison codes
a_star· eligible when the year and group match · exact · 0 decimal places · origin Pa_star_a· eligible when the year and group match · exact · 0 decimal places · origin Pa_star_b· eligible when the year and group match · exact · 0 decimal places · origin P
Check log
- 2026-11-11 ·
entries· verified · Eton College GCE Summer 2026 Statistics · PDF page 1; GCE A Level Overall row, Entries column - 2026-11-11 ·
a_star_count· verified · Eton College GCE Summer 2026 Statistics · PDF page 1; GCE A Level Overall row, A* column - 2026-11-11 ·
a_count· verified · Eton College GCE Summer 2026 Statistics · PDF page 1; GCE A Level Overall row, A column - 2026-11-11 ·
b_count· verified · Eton College GCE Summer 2026 Statistics · PDF page 1; GCE A Level Overall row, B column - 2026-11-11 ·
c_count· verified · Eton College GCE Summer 2026 Statistics · PDF page 1; GCE A Level Overall row, C column - 2026-11-11 ·
d_count· verified · Eton College GCE Summer 2026 Statistics · PDF page 1; GCE A Level Overall row, D column - 2026-11-11 ·
e_count· verified · Eton College GCE Summer 2026 Statistics · PDF page 1; GCE A Level Overall row, E column - 2026-11-11 ·
u_count· verified · Eton College GCE Summer 2026 Statistics · PDF page 1; GCE A Level Overall row, U column - 2026-11-11 ·
a_star· verified · Eton College GCE Summer 2026 Statistics · PDF page 1; Percentages and cumulative rows (A*, A*–A, A*–B) - 2026-11-11 ·
a_star_a· verified · Eton College GCE Summer 2026 Statistics · PDF page 1; Percentages and cumulative rows (A*, A*–A, A*–B) - 2026-11-11 ·
a_star_b· verified · Eton College GCE Summer 2026 Statistics · PDF page 1; Percentages and cumulative rows (A*, A*–A, A*–B) - 2026-11-11 ·
pass· verified · Eton College GCE Summer 2026 Statistics · PDF page 1; Cumulative A*–E
All Eton College records like this · Report a problem with this figure (opens an email to corrections@theschoolsrecord.co.uk, or write a fuller report)