Eton College · sixth form · summer 2025
Eton College, sixth form 2025: 40.2% of 916 entries at A* or equivalent
Compared
40.2%
A* or equivalent, all sixth-form exams · Comparable figure · A levels only this year, so it is the school’s own figure
of 916 entries
The school’s figure: 40.2%. The same figure: it is the school’s own.
Grades as sat
A level: 40.2. Subjects and grades
This year’s exams: A levels only.
We know because the government’s tables confirm it.
See the page it came fromSource pages: A*–A or equivalent, all sixth-form exams
Read these pagesThe page it came from
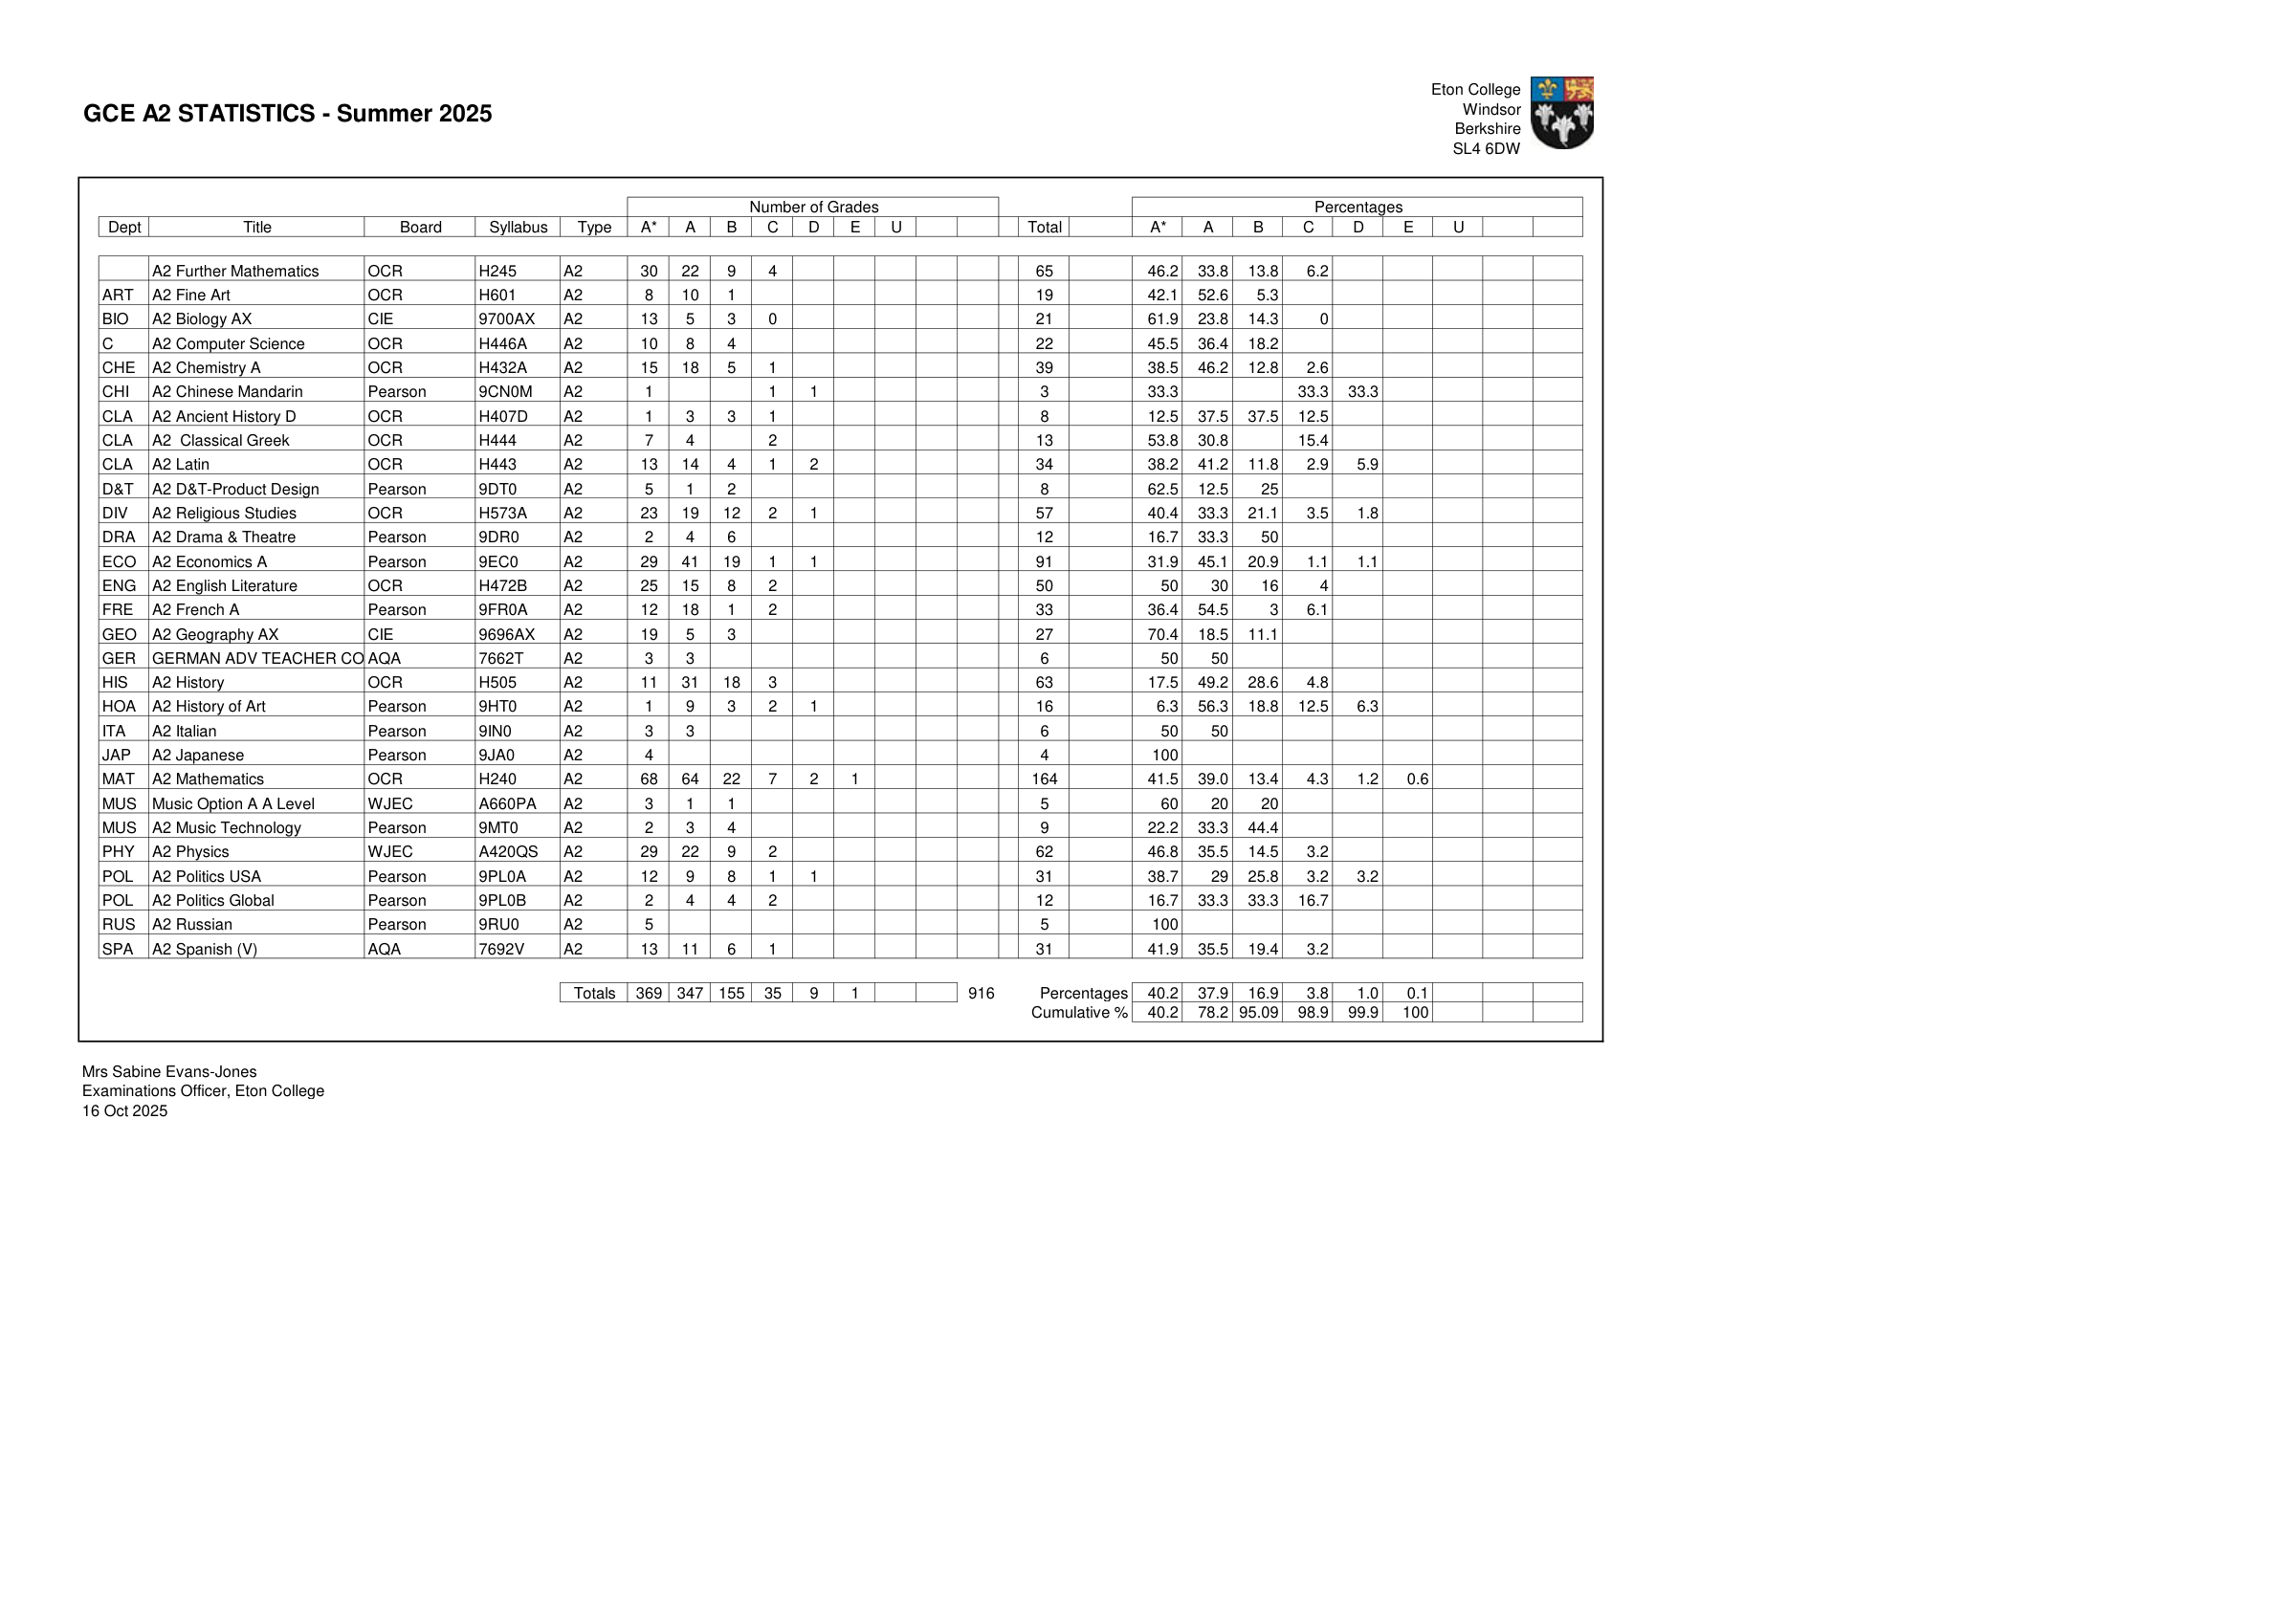
The marked rows are the ones used in this record. Open the original to read them in their full document.
A level
Dept Title Board Syllabus Type A* A B C D E U Total A* A B C D E U
Totals 369 347 155 35 9 1 916 Percentages 40.2 37.9 16.9 3.8 1.0 0.1
Cumulative % 40.2 78.2 95.09 98.9 99.9 100
Eton College A-level 2025 — school final results · PDF page 1. Open the original
The page it came from
The marked rows are the ones used in this record. Open the original to read them in their full document.
A level
Dept Title Board Syllabus Type A* A B C D E U Total A* A B C D E U
Totals 369 347 155 35 9 1 916 Percentages 40.2 37.9 16.9 3.8 1.0 0.1
Cumulative % 40.2 78.2 95.09 98.9 99.9 100
Eton College A-level 2025 — school final results · PDF page 1. Open the original
Source pages: A*–B or equivalent, all sixth-form exams
Read these pagesThe page it came from
The marked rows are the ones used in this record. Open the original to read them in their full document.
A level
Dept Title Board Syllabus Type A* A B C D E U Total A* A B C D E U
Totals 369 347 155 35 9 1 916 Percentages 40.2 37.9 16.9 3.8 1.0 0.1
Cumulative % 40.2 78.2 95.09 98.9 99.9 100
Eton College A-level 2025 — school final results · PDF page 1. Open the original
| Grade band | Comparable figure (our calculation) | The school’s figure (as the school published it) | Original grades |
|---|---|---|---|
| A*–A or equivalent, all sixth-form exams | 78.2% of 916 entries | The same: it is the school’s own figure | A level: A*–A 78.2% of 916 |
| A* or equivalent, all sixth-form exams | 40.2% of 916 entries | The same: it is the school’s own figure | A level: A* 40.2% of 916 |
| A*–B or equivalent, all sixth-form exams | 95.1% of 916 entries | The same: it is the school’s own figure | A level: A*–B 95.1% of 916 |
How we built it
The number of entries at or above the band, across every exam system, divided by all the entries. We never average two percentages.
- A*–A or equiv.: A level A*–A 78.2% of 916 entries, as printed
- A* or equiv.: A level A* 40.2% of 916 entries, as printed
- A*–B or equiv.: A level A*–B 95.1% of 916 entries, as printed
The records it is built from
Cite this figure
Eton College, 2025, A* or equivalent, all sixth-form exams: 40.2% (comparable figure, our calculation; A level A* 40.2% of 916 entries, as printed). Method harm-v1. Records: fig:eton_alevel_primary_sheets:4, research:eton:2025:audit-current-Final-Statistics-Summer-2025. The Schools Record, https://theschoolsrecord.co.uk/evidence/harm:v1:eton:2025:sixth-form/
Record details
Record ID harm:v1:eton:2025:sixth-form. Quote it if you report a problem.
As recorded
The record’s own wording, where this page puts it in plainer words.
- A*–A or equiv.: basis
- A level only this year, so this is the school’s own figure
- A*–A or equiv.: note
- A level: Eton’s signed final A-level table supplies exact graded-award counts: 716 of 916 at A*–A and 871 of 916 at A*–B. Its annual report agrees on A*–A but prints 95.0% at A*–B against the table’s 95.09%. Both readings remain visible; this comparison uses the signed grade counts.
- A*–A or equiv.: precision
- 1 decimal place, as printed
- A* or equiv.: basis
- A level only this year, so this is the school’s own figure
- A* or equiv.: precision
- 1 decimal place, as printed
- A*–B or equiv.: basis
- A level only this year, so this is the school’s own figure
- A*–B or equiv.: note
- A level: Eton’s signed final A-level table supplies exact graded-award counts: 716 of 916 at A*–A and 871 of 916 at A*–B. Its annual report agrees on A*–A but prints 95.0% at A*–B against the table’s 95.09%. Both readings remain visible; this comparison uses the signed grade counts.
- A*–B or equiv.: precision
- 1 decimal place, as printed
- A level: entries
- 916 (printed entries)
- Which exams were sat: evidence
- A level: 33 school or ISC records (e.g. fig:eton_alevel_primary_sheets:4); 53 DfE rows (e.g. new:eton:2025:dfe-ks5-institution-aggregated-results-11936)
Source references
FB146· Our research file (not public). A companion file we made for seven schools, with our list of archived copies of their web pages. (as recorded: “latest seven-school companion and Wayback/destination lock”)SIX_AUDIT_6A81CCF2A14ABB22· Eton College A-level 2025 — school final results · Exact publication checked for the named qualification, year and source population
Method and version
- Method
harm-v1 1.0.0- Inputs digest
sha256:e8b5c7bf8f5a57358584fa240779f09f4aa0e0c74ff4d21628a6e228acef2dc8- Qualification mix
A level (government-table)